The XEC Variant Poised to Overtake KP.3.1.1 as Dominant COVID Variant by November. Increasing Hospitalizations in the U.K.- 3 Hospitals Reinstate Masking
XEC Variant Reaches 12% Prevalence in California-Nevada, Set to Dominate by Late October. XEC at 13% in Germany.
We began reporting on XEC, a recombinant variant of KS.1.1 and KP.3.3, as soon as it was designated in early August. XEC has now appeared in the latest CDC variant proportions update, showing a 6% prevalence in the U.S. Meanwhile, KP.3.1.1 has continued to expand, reaching 58% prevalence nationally.
U.S. Variant Proportions
In the August 6th update, TACT reported “The XEC (KS.1.1 and KP.3.3 recombinant) variant's swift international spread and unique mutation profile indicate it may possess increased transmissibility and potential immune escape capabilities.” XEC continues to expand rapidly in the U.S. and globally, with a growth advantage twice that of KP.3.1.1. Its prevalence is doubling every 9 to 10 days, putting it on track to reach 50% in most of the U.S. between November 1 and 15, 2024. In the California-Nevada region, where XEC has already surpassed 12%, it may hit 50% by the third week of October. This timing suggests a much larger surge as we head into November and December. We’ll explore the reasons for this below.
As we head into the fall, the rise of this new COVID variant is quietly reshaping the landscape of the pandemic. Mask mandates have already returned to several U.K. hospitals, and case numbers continue to climb in the U.K., with XEC increasing across Europe and around the world. The U.S. may not be far behind, as the U.K. typically leads by a few weeks. Complicating matters, Rhinovirus is surging in the U.K., and with overlapping symptoms, distinguishing between these respiratory threats is more important than ever. We will break down the similarities and differences between them.
With the rise of the XEC variant and concerning changes in CDC guidelines, the coming months could see a much bigger surge than last November and December. But what exactly is driving this rapid spread into late December and subsequent rapid decline before the travel for the holidays ends. Why might it be happening sooner than anticipated this year? Read on to uncover the key forces at play. The answers may surprise you—explore the latest findings in our deep dive.
By subscribing, you’re helping support:
Unbiased reporting: We cut through the noise and deliver critical information you need to make informed decisions about your health.
If you're able, please consider upgrading to a paid subscription to help sustain this work. Many articles are shared with all subscribers right away, but for more time-intensive research, paid subscribers receive early access until we can expand the base. By becoming a paid subscriber today, you’re helping towards the goal of making every article available to everyone as soon as it's published. Your support truly makes a difference!
Support Independent Journalism - Become a Paid Subscriber Today!
Sweden Variant Proportions
In Sweden, the variant landscape closely mirrors that of the U.S., with KP.3.1.1 currently dominant, followed by KP.2.3 in second place, and XEC at 5%. This suggests that XEC is on track to reach 50% prevalence in Sweden around the same time as in the U.S.
Flash Back - May 6, 2024 Summer Forecast Predictions Were Accurate
The May 6, 2024 summer forecast, stated, “In the U.S., it will likely begin increasing by mid-June, possibly a little earlier, particularly in the Southern states. The prevalence will start increasing at a faster pace into July and August, and peak in the first couple weeks of September. The peak is likely to go quite a bit higher than last summer.” This summer surge did indeed go quite a bit higher. On June 25th, TACT reported that the summer is going as expected, except for the latest KP.3 sub-variants, with KP.3.1.1 surging to the highest growth advantage.
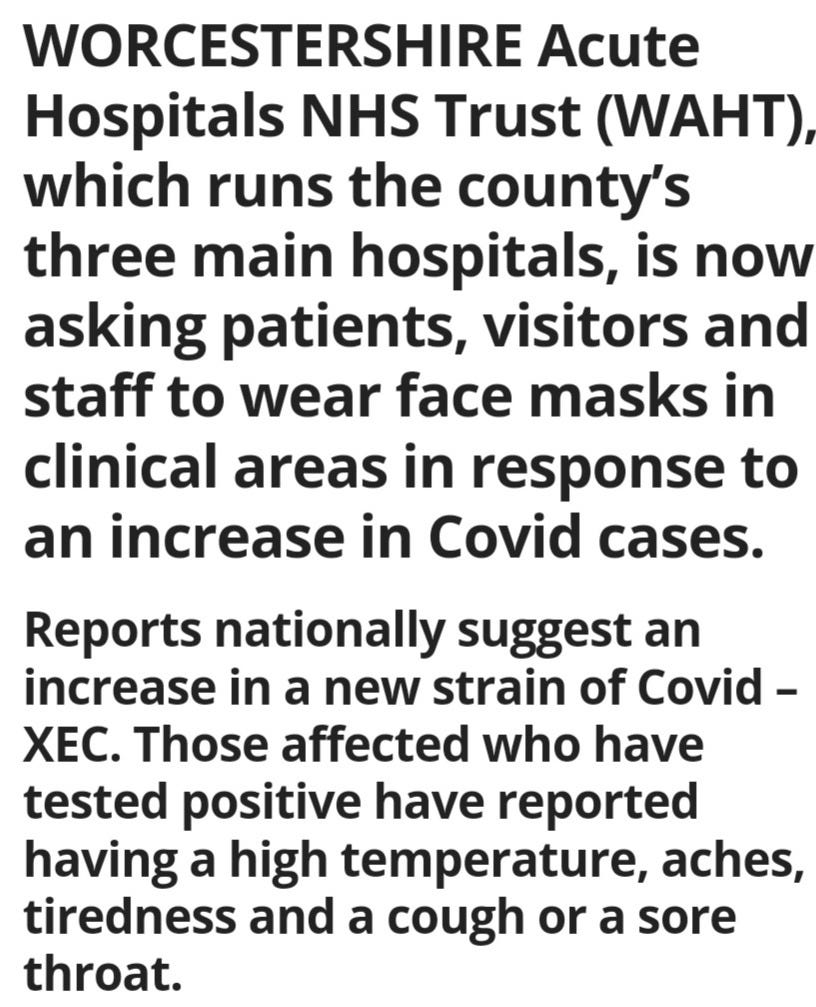
XEC cited as the reason for reinstating masking in 3 U.K. hospitals.
According to the U.K. HSA dashboard, COVID cases increased 31.5% in the 7-day rolling average up through Sept. 18, 2024. The Bromsgrove Standard reported on Sept. 30th that the staff, visitors, and patients are urged to wear face masks at the Alexandra and Worcestershire Royal Hospitals after the rise in Covid cases. They are attributing the increase in COVID cases to the new XEC variant.
COVID Deaths in the U.K.
The current data likely hasn't yet been impacted by the XEC variant, but it's important to note that many pneumonia deaths are initially caused by COVID. When they say only 1% involved COVID, that may not be accurate. ONS.gov says “In the week ending 13 September 2024, 12.2% of registered deaths involved influenza or pneumonia (1,203 deaths), while 1.0% involved coronavirus (COVID-19) (96 deaths).”
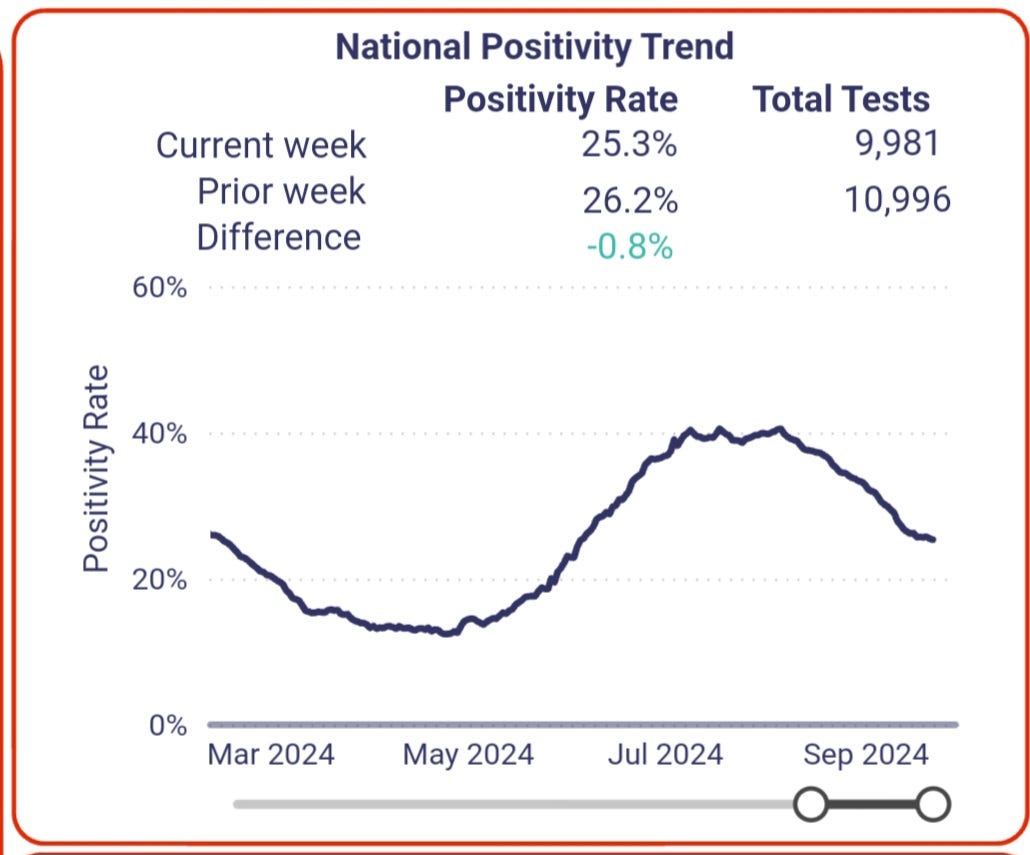
The U.S. Positivity Rate according to Walgreens Dashboard
The U.S. positivity rate was declining quickly, but according to the Walgreens data, we are seeing that slow down. It will likely plateau with some minor changes for a couple of weeks before increasing exponentially sometime in mid to late October. If that increase happens earlier than it could be a signal for how bad it could get in November and December.
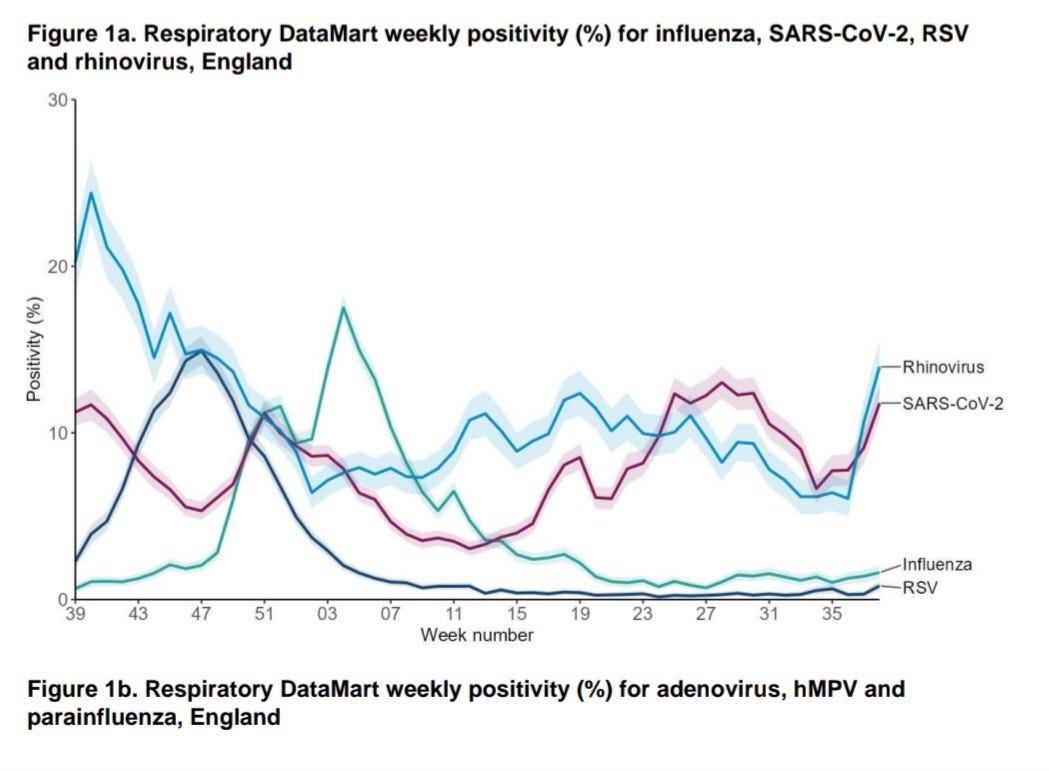
The U.K. Positivity Rate for COVID, RSV, Influenza and Rhinovirus
The U.K. typically trends 2 to 3 weeks ahead of the U.S., and we're already seeing a rapid rise in positivity rates. This surge is expected to continue well into October. Adding to the challenge is the increasing prevalence of Rhinovirus. With other viruses at low levels, if you're sick in the U.K. right now, chances are it's either COVID, Rhinovirus, or both.
Both Rhinovirus and COVID cause nasal congestion, runny nose, sore throat, cough, headaches, and body aches. COVID is more likely to cause fatigue, shortness of breath, and gastrointestinal symptoms like nausea and diarrhea. Symptoms can last 1 to 2 weeks with both viruses, but only COVID leads to Long COVID which can last for months or years. It is important to test yourself or your doctors to know which virus you have and to have a record, in case you need to file for disability later.
It’s important to remember that coinfections of COVID and flu, RSV, Rhinovirus, and other viruses are often more severe. A study from 2020 found that rhinovirus/enterovirus and COVID coinfections were the most common, followed by RSV and COVID coinfections.
Another study from 2023 also confirmed the coinfection data, but importantly they said, "It is also recommended that masks (especially N95/P2 masks if possible) are used during periods of increased activity of respiratory viruses by those who are vulnerable and ➡️ especially by all medical and nurse staff and frontline healthcare staff." Considering COVID is now constantly circulating at a high rate, healthcare workers should always wear N-95 or P2 masks to protect their patients.
On Sept. 26th, inews reported a 30 % spike in COVID infections in the week leading up to Sunday. During the same period, the proportion of hospital patients in England testing positive rose from 9.1 percent to 11.8 percent. Notably, 1 in 10 COVID cases is now attributed to the XEC variant.
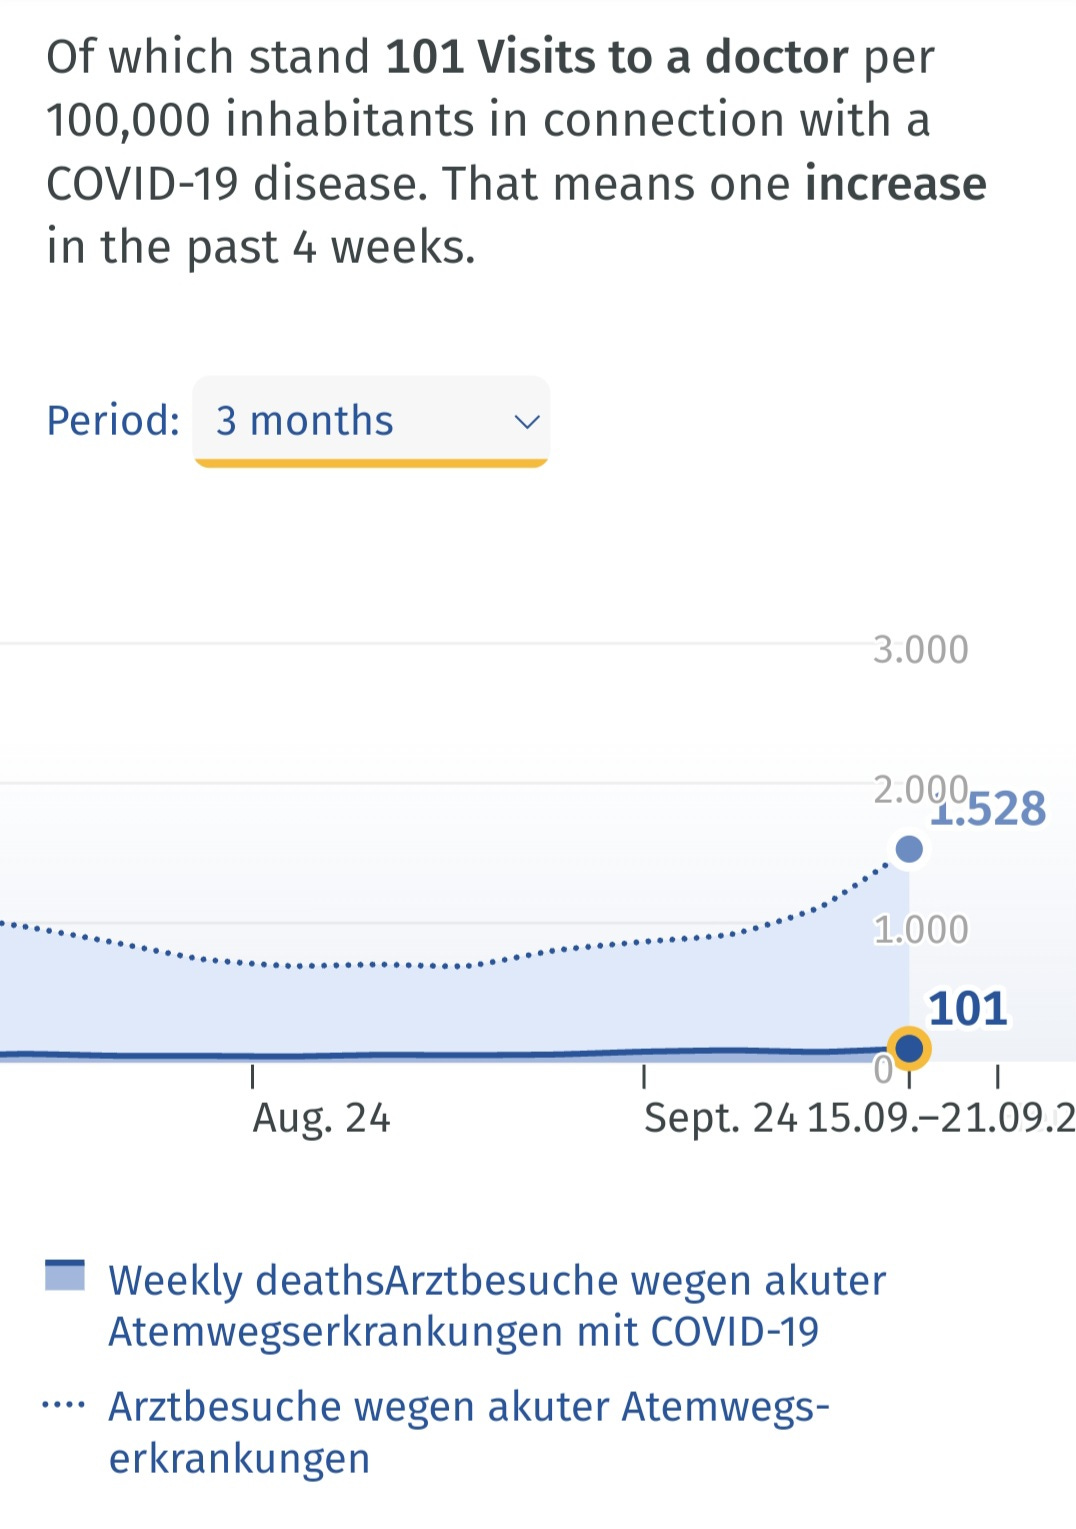
Germany
Visits to the doctor for acute respiratory illnesses is increasing.(Top dotted line)XEC is estimated to be at around 13% prevalence in Germany.
Where is the advantage of XEC over KP.3.1.1?
As highlighted in TACT’s August 6th article on XEC, there is a notable change in the Spike protein between KP.3.1.1 and XEC. Specifically, XEC, dropped the S:31-, and added S:T22N and S:F59S mutations. This combination of T22N and F59S likely enhances viral transmissibility and immune evasion, which helps to explain why XEC is spreading twice as fast as KP.3.1.1, even in areas where KP.3.1.1 has dominated the COVID landscape. Unfortunately, the immune response to recent infections or that induced by the vaccines is unlikely to prevent infection or transmission.
To make matters worse, XEC has other mutations that may be adding additional immune evasion or suppression capabilities. This was described in the previous update on XEC.
The XEC Variant is Gaining Momentum: What Its Spread May Mean for Symptom Severity, Long COVID, Vaccine Efficacy, and the Future of the Pandemic
As of September 21, 2024, XEC prevalence is doubling, approximately, every 9 days, from Sept 3rd, which means it would be nearing or surpassing KP.3.1.1's numbers as they are today, between Nov. 1 and November 15th, the time exponential growth launches into the end of December.
Dr. Mike Hoerger’s Forecast
Tact’s Overview
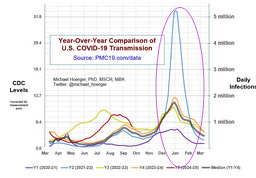
Dr. Hoerger is pointing out that this is the steepest decline after a summer peak. We can see an example of a steeper decline from December 31st, in this graph. This was huge summer surge due in part to the KP.3.1.1 variant, but the even larger change was in the CDC guidance allowing people to return to school or work after just 24 hours from not having a fever. The biggest problem with this guidance is that a very large amount of people with symptoms don’t have fevers. The other problem is that around 40% of adults and 60% of children are asymptomatic, yet contagious. So why do we have such a steep decline after a larger surge?
The steeper the exponential growth preceding an event that interrupts it, the sharper the subsequent decline. This pattern is consistently observed in late December. A prime example is the JN.1 surge, where rapid exponential growth was abruptly halted by the winter school break. This intervention led to a steep exponential decay in cases and wastewater prevalence thereafter.
In the info graph below, we can see the steep blue line and subsequent decline at a similar pace in relation to how fast it increased. We can also see that the surge of COVID increases until around December 31st every year.
Consider this: if holiday gatherings were the primary driver of a surge, we wouldn’t see case increases starting in October or early November and tapering off before the holiday travel season ends. The surge would continue well past New Year’s celebrations, into mid-January, in line with the incubation period and the 8-10 days of infectiousness following holiday gatherings, instead, exponential decay began just before New Year’s last year.
While high transmission does occur during holiday events, it’s not at the same level as the exponential growth seen in the school-to-home transmission cycle. The virus follows an efficient pathway, spreading from students in classrooms to their siblings at home, who then bring it back to new classrooms. In elementary or primary schools, this results in exposure to roughly 30 students in close quarters for hours each day. The spread is further amplified in the packed hallways, cafeterias, and classrooms of secondary, intermediate, and high schools.
When schools close for an extended period, like the winter break, it interrupts this chain of transmission, allowing enough time for children to clear the virus and resetting the exponential curve to the base community transmission rate.
Unfortunately, the highest-projected track in this forecast may become a reality. The CDC guidance allowing students and staff to return to school and work while still contagious, combined with the rise of the XEC variant—outcompeting KP.3.1.1 and likely becoming dominant by early November—significantly increases the odds of an earlier surge. As a result, we may see a more rapid acceleration in cases and a higher overall prevalence compared to last year. Let’s hope this scenario doesn't unfold, but all signs point in that direction based on the current evidence.
Share your thoughts, concerns, experiences, or questions.
Coming Soon….
In our next update, we'll dive into the rise of the XEK variant, a recombinant strain formed from XEC and KP.2.3. XEK exhibits an even greater growth advantage than XEC. Though still in its early stages, this variant has already made its way to the U.S., the U.K., and several countries across Europe—and likely beyond.






Do we know if XEC will be able to reinfect people who have recovered from KP. 3.1.1? It seems to me this will determine how bad the wave will be. Love this Substack!
TACT...Well, a hat tip to your May 2024 Summer Forecast. I would say you nailed that impressively.
So, it appears you are tentatively forecasting a winter surge lift-off around late October?
I eagerly await your Winter 24/25 forecast, despite the fact that it likely won't be pretty.