The COVID Wave is Surging: KP.3.1.1 Rising to Dominate the COVID Landscape
The Current Risk, What to Expect and a Global-View of Data from Various Countries Around the World

The current COVID-19 wave is intensifying across the U.S., U.K., and many other countries, with the KP.3 variants becoming globally dominant. This surge is surpassing last summer’s levels in the U.S. and other nations. Many regions in Europe, including Austria, Belgium, Denmark, Finland, Germany, Greece, Hungary, the U.K., Switzerland, Sweden, the Netherlands, and Luxembourg, are also seeing rising prevalence.
In this update, we take a detailed look at the various factors driving this surge. The KP.3 variants are a huge factor but it isn’t the whole story. We will look at the risk of infection, and the updated variant proportions in the U.S. We will go over what to expect in the coming months, and review the latest data from countries around the world.
Data on the Decline
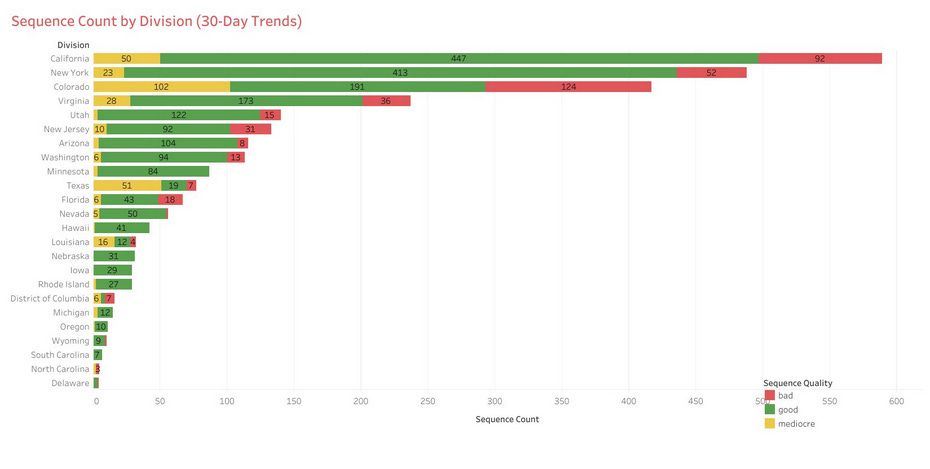
Only 32 or 33 countries, depending on how you consider Taiwan, of the 193 countries in the United Nations are reporting updated sequencing data.
In the U.S., only 24 of the 50 states are reporting sequencing data.
The gaps in our view of what is happening are widening at a time COVID’s evolution is increasing in pace. We will look at more detailed data from various countries around the world a little further down in this update.
Overview of Virus Prevalence in the U.S.
In the U.S., according to Wastewater Scan, Influenza A and B, Human Metapneumovirus, EVD68, Candida auris, and Hepatitis A are all at low levels, while SARS-CoV-2, RSV, and Norovirus are increasing. SARS-CoV-2 and Norovirus are considered to be at High levels. RSV is still at a very Low level but it is starting to increase. If you are sick, there is a very good chance that it is COVID. Stay home to protect yourself from secondary infections and protect everyone else from being infected. Remember that the rapid tests may not detect it until the 4th day after symptoms started and that you may still be contagious for 8 to 10 days even if you start feeling better after 4 or 5 days.
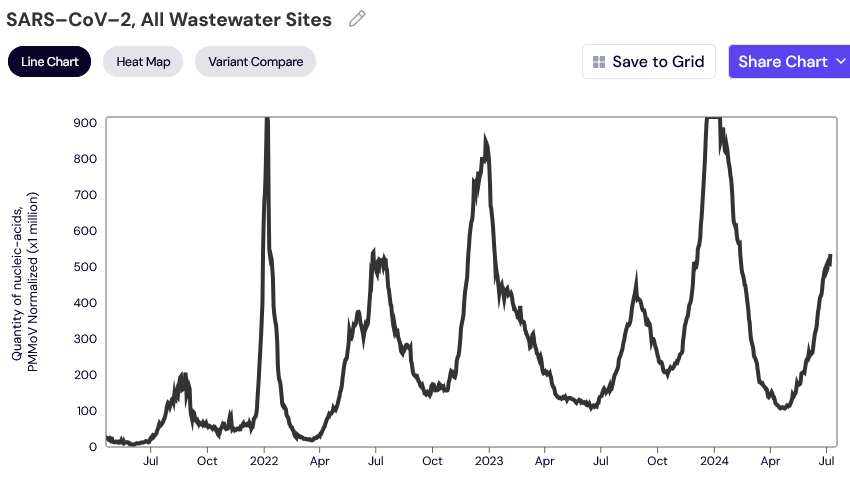
If we look at the national view of SARS-CoV-2 we see that the U.S. is exceeding the levels of all the previous summers. The prevalence is higher than the vast majority of the pandemic. Only the December surges grew to greater prevalence than now.
Once again, this was predictable. TACT’s summer forecast from May 6, 2024, said “In the U.S., it will likely begin increasing by mid-June, possibly a little earlier, particularly in the Southern states. The prevalence will start increasing at a faster pace into July and August, and peak in the first couple weeks of September. The peak is likely to go quite a bit higher than last summer.”
CDC COVID-19 Growth Estimates
According to the CDC, COVID cases are growing in the vast majority of the U.S. The places that show stable or uncertain, are more likely uncertain due to a lack of data.
According to JWeiland, July 19th update, there is another substantial increase (+26%) this week. The wastewater signal is now higher than last summer's peak, and over a month earlier.
780,000 new infections/day
1 in every 43 people currently infected
45% higher than 12-month avg.
Ratio of people currently infected by region:
Midwest: 1 in 59
South: 1 in 34
Northeast: 1 in 73
West: 1 in 25
U.S. COVID Forecast
There will likely be a leveling-off and decline coming within the next week or two that will last for 6 to 8 weeks in the South and much of the West before the exponential growth between schools and homes drives overall prevalence back up. This will occur almost a month later in much of the Midwest and Northeast U.S.
With the incoming variants of KP.3.1.1, KP.3.1.1.1, and KP.3.3.1 there is cause for caution. Particularly KP.3.3.1 with the new ORF3a mutation. The rate of transmission could be quite high with these variants due to increased ACE-2 binding and the high level of immune evasion and suppression, surpassing the KP.2 variants.
U.S. Variant Proportions
What variants are driving this surge? We can see in the variant proportions provided by the CDC, below, that KP.3.1.1 is surging from 6.8% in the previous update to 17.7%. It more than doubled in the past two weeks. LB.1 and every other variant is losing ground to KP.3.1.1.
Unless something changes we can expect the KP.2 variants to be extinct by the end of the summer. The evolution within KP.3 has already moved so fast that the original KP.3 is being pushed out by KP.3.1.1, which will be followed by KP.3.1.1.1 and KP.3.3.1. We’ll dig into KP.3.1.1.1 and KP.3.3.1 in coming updates.
"The Rise of KP.3.1.1: Enhanced Infectivity and Implications for Vaccine Effectiveness"
https://tactnowinfo.substack.com/p/the-rise-of-kp311-enhanced-infectivity
For people reading TACT’s updates, the rise of the KP.3 variants, including KP.3.1.1 shouldn’t come as a surprise. We started raising the alarms on KP.3 back on May 13, 2024. “COVID: Shifting Tides: The Emergence of KP.3 in the Shadow of KP.2's Dominance. What's Driving KP.3's Rapid Growth?” “KP.3's Ascent Raises Alarms.”
KP.3.1.1 was in the spotlight in the July 6, 2024 update highlighted here.
“We now face KP.3.1.1, which is short for JN.1.11.1.3.1.1. Let’s look at the growth advantage of JN.1 through KP.3.1.1 from right to left in the graph below. We can see KP.3.1.1 has taken a big leap in growth advantage and why it's able to surge, evading the immune response to JN.1 while also having a stronger ACE-2 binding ability, making infection easier.”
Unfortunately, the number of sequences coming in is too low for the CDC to graph any regions other than regions 8 and 9 for now. These show KP.3 dominant with KP.3.1.1 gaining ground. It will be interesting to see the other regions get updated as more sequences come in over the next couple of weeks.
Global-View of Data from Various Countries Around the World
Australia
Australia is one of the view places seeing a decline in hospitalizations, with the peak around July 2nd.
With a few exceptions, Australia’s aged care homes are also seeing a decline in outbreaks and individual cases.
Why is there a decline in Australia when the KP.3 variants continue to increase, just like everywhere else around the world? What happened in Australia that didn’t happen in so many other countries? Find the answer at the end of this update.
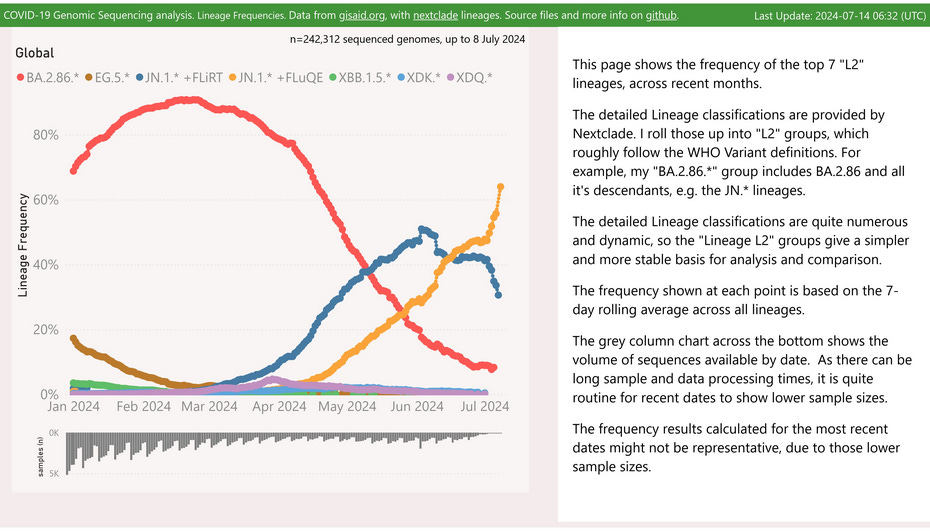
According to Mike Honey, "FLuQE" variants (KP.3.*) continue to dominate "FLiRT" and show strong growth in most states.”
He also shows that globally, the KP.3 variants are dominating.
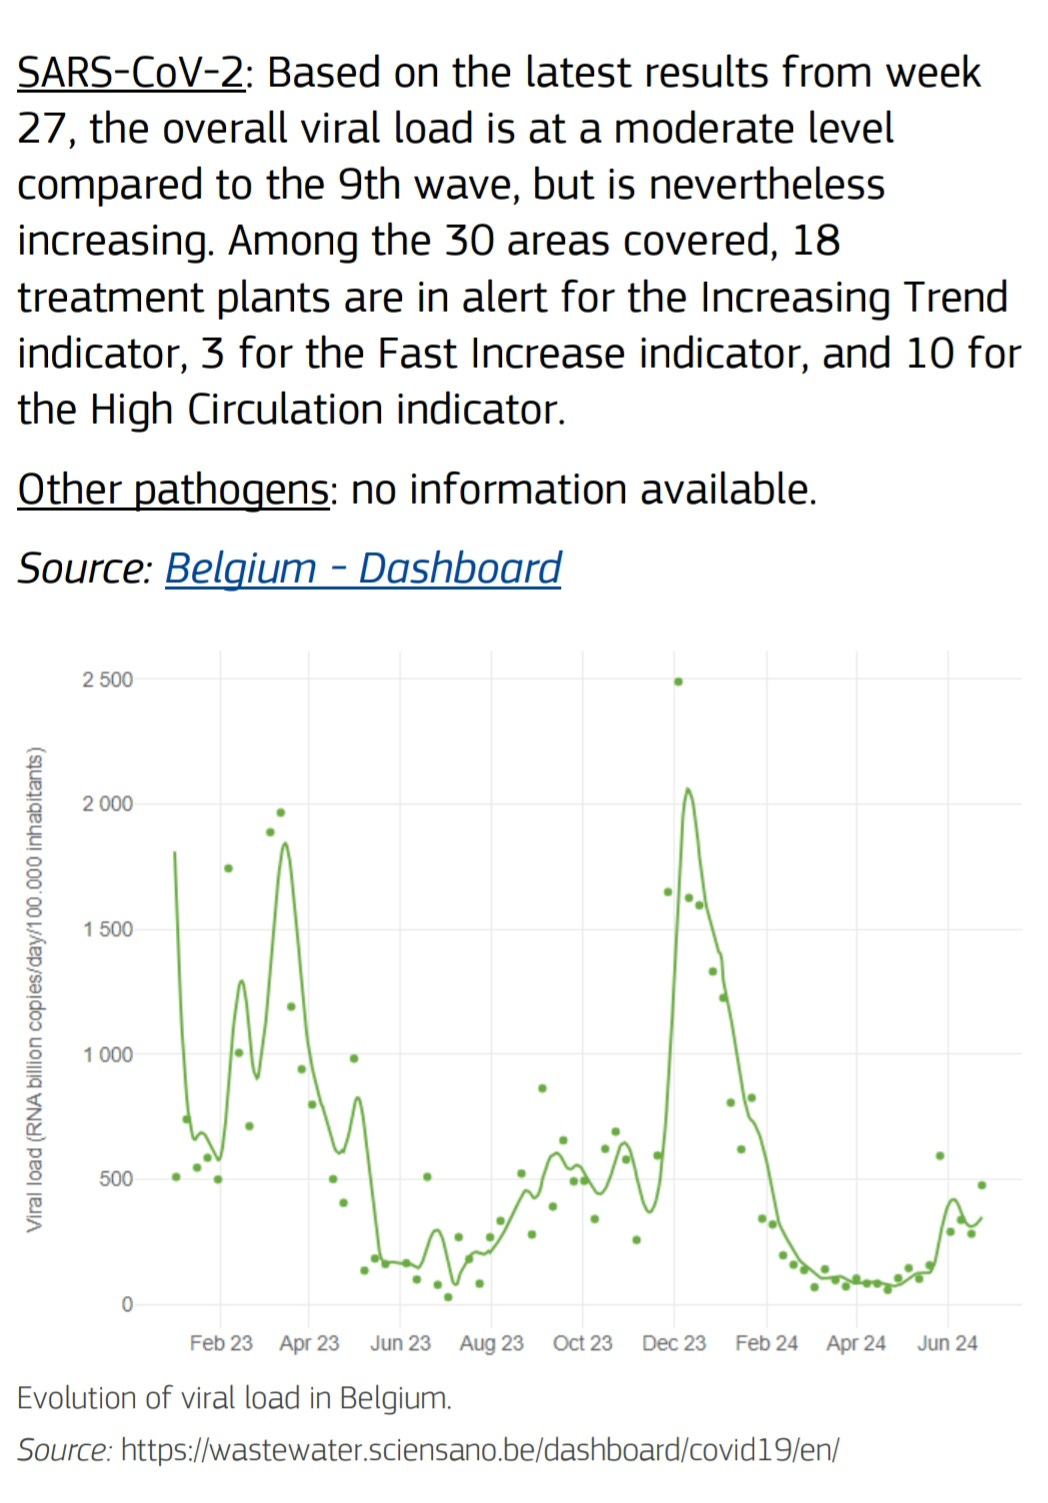
Belgium Wastewater Prevalence
Denmark
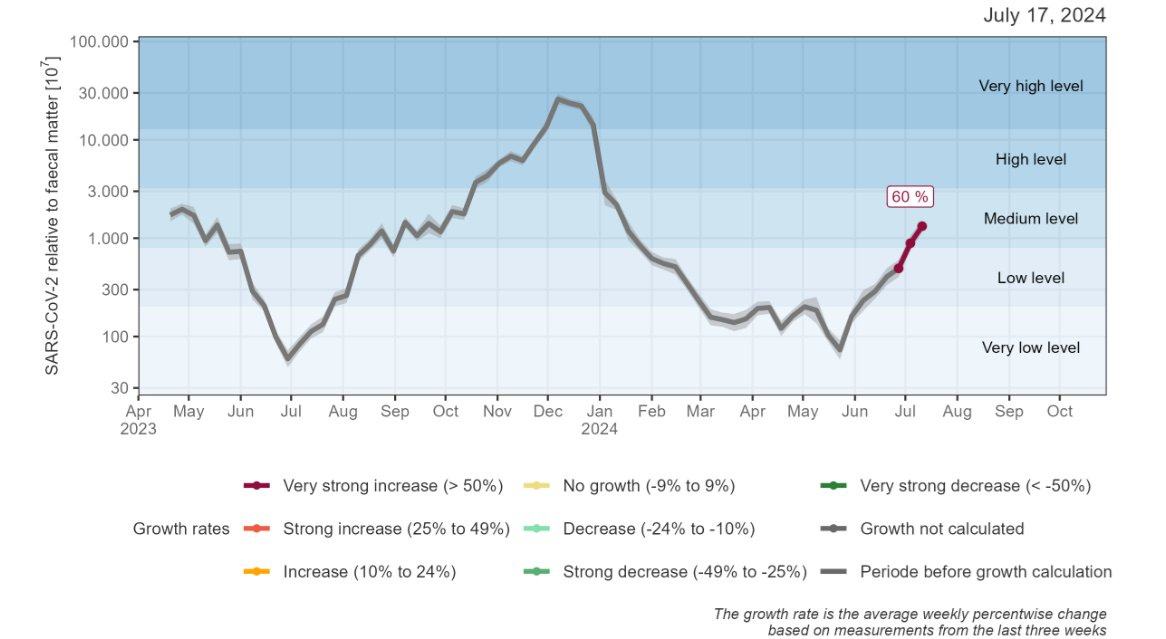
Denmark is seeing a 60% increase in the wastewater prevalence.
Germany
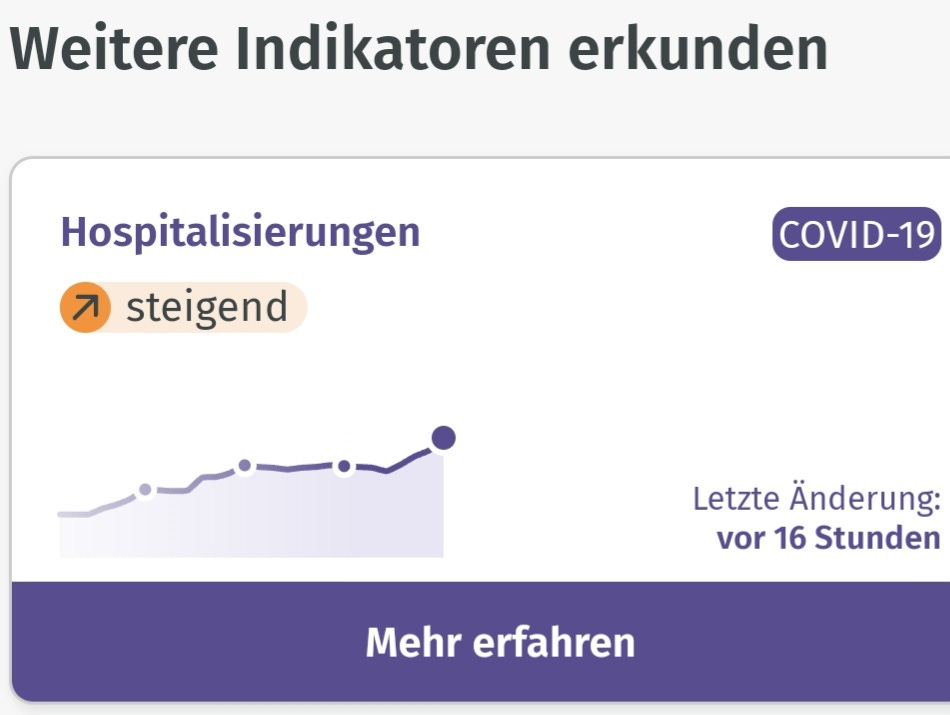
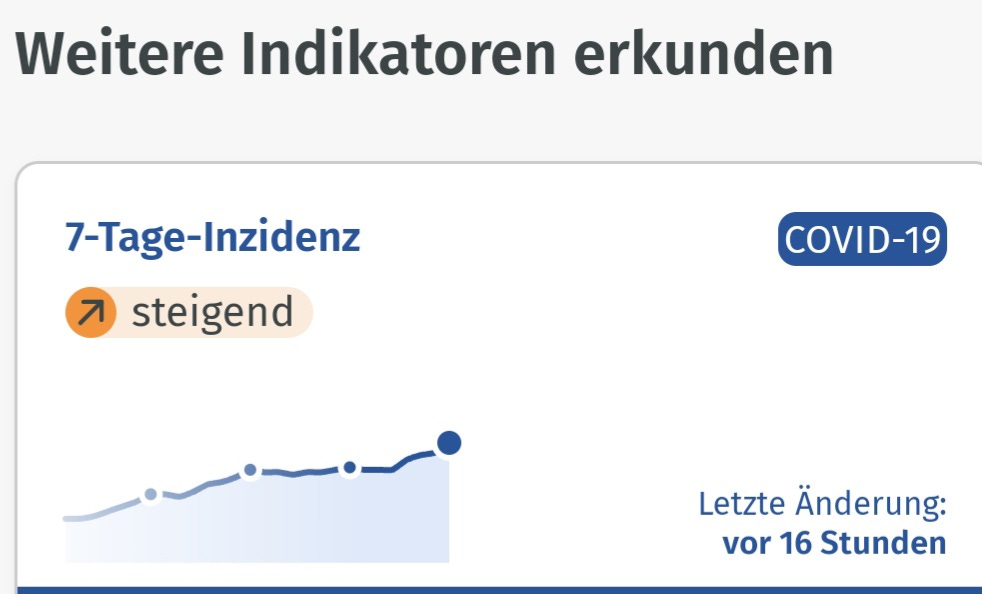
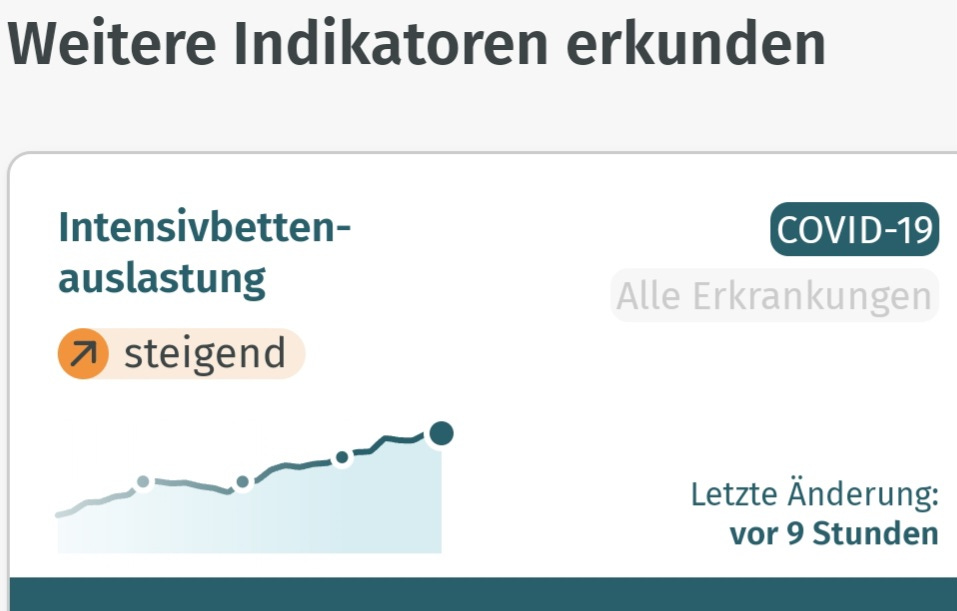
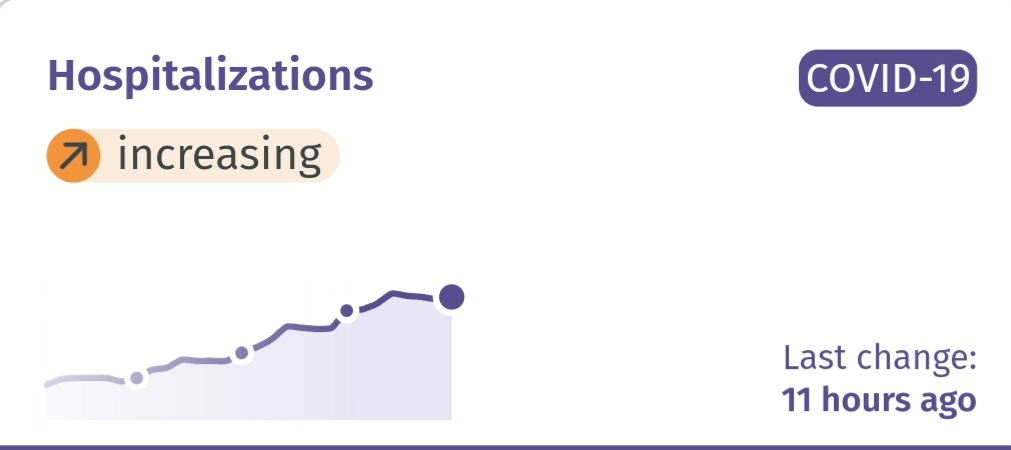
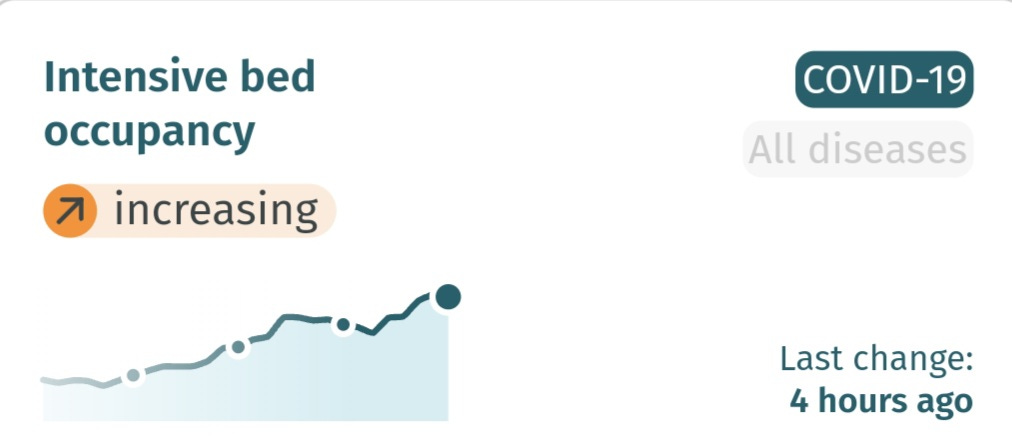
Hospitalizations, Intensive Care, and Deaths are Increasing. It's updated from July 17, 2024.
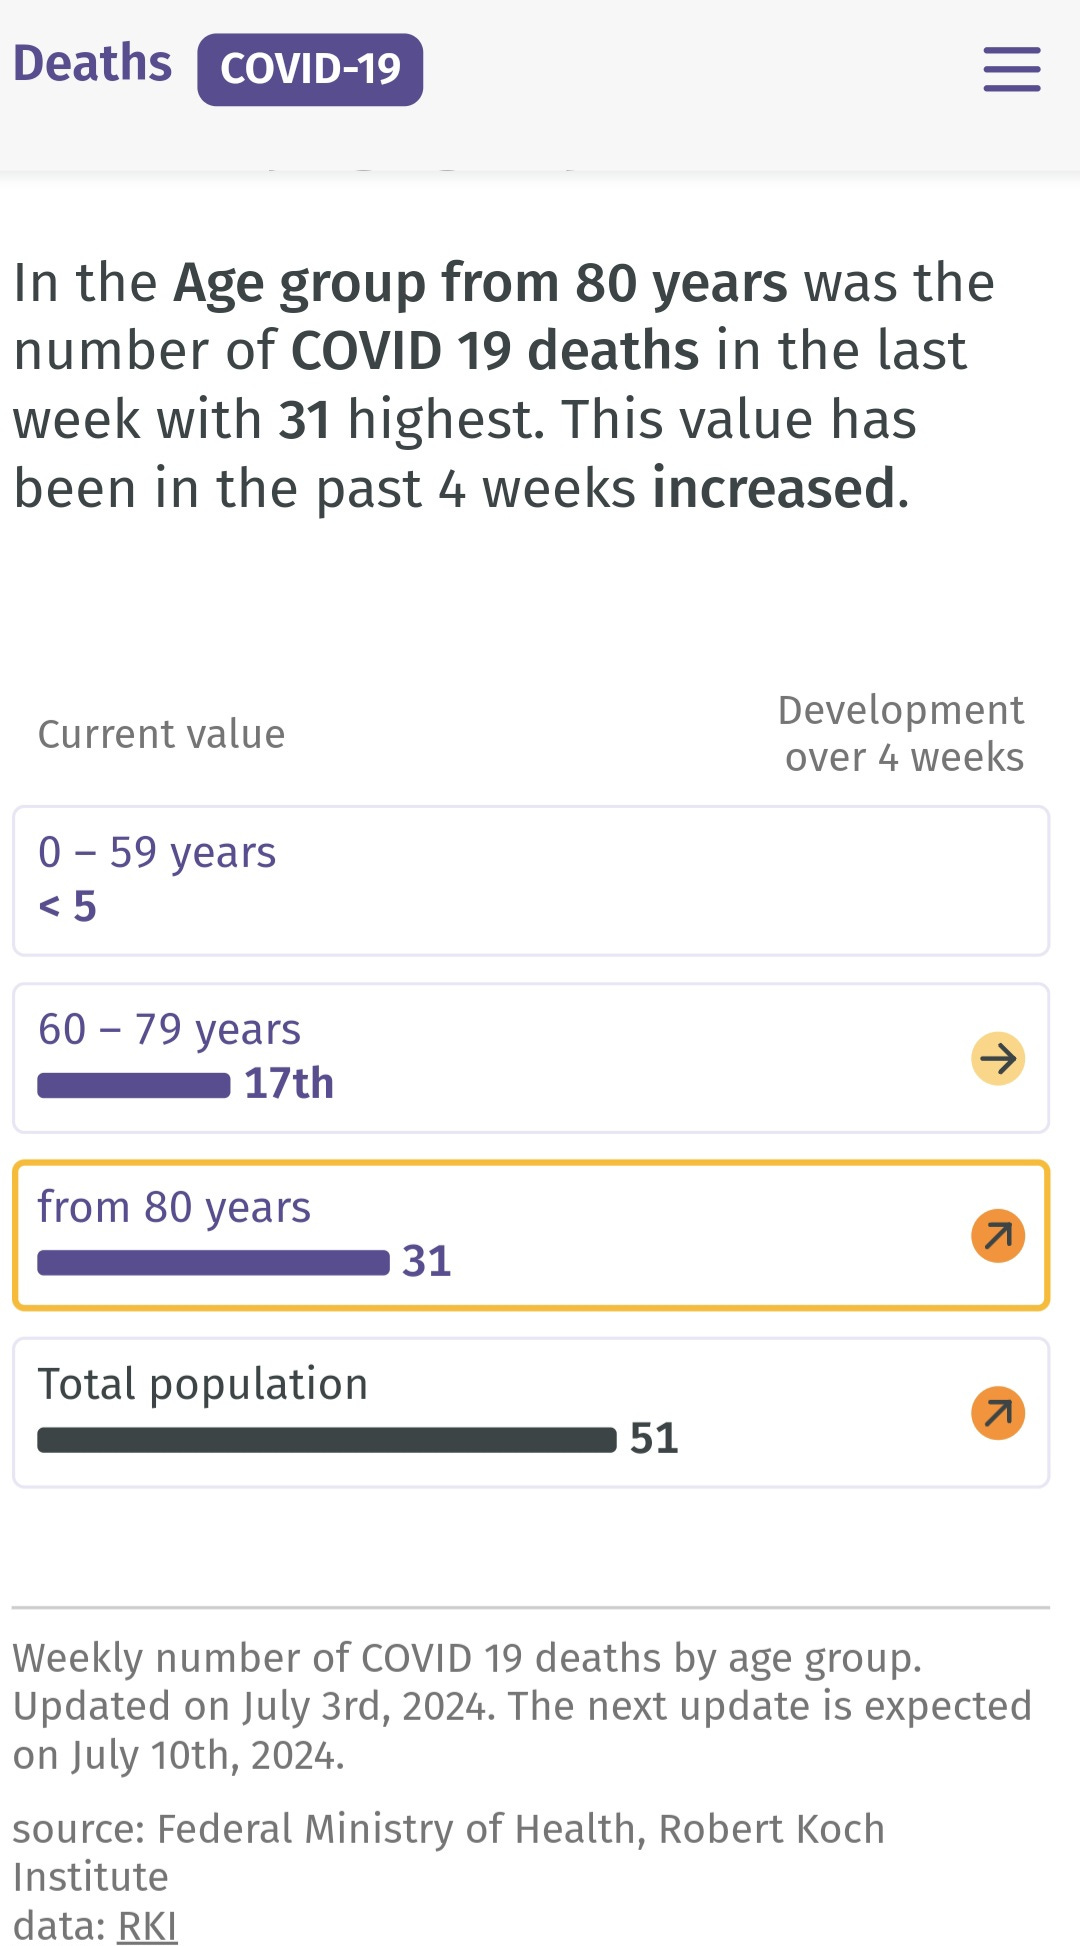
Below are the earlier updates from July 3, 2024, at 12:30 pm EST.
Adults over 80 are dying at the highest rate in Germany and most places around the world.
The United Kingdom
Similar to the U.S., all the other viruses are at the lowest levels of the year, while COVID-19 cases have increased by 17% as of July 10, 2024. London appears to have the largest spike in positive PCR tests. The hospitalizations increased by 2.2% as of June 28, 2024, so we can expect that has increased quite a bit up to the present time.
The positivity rate is almost as high as the peak in October of 2023.
Consider this question: Why does the U.K. experience its highest COVID-19 peak in October, followed by a smaller surge in late December and early January, while the U.S. has a consistent surge from October through December, peaking higher than the U.K. in late December and early January? Similarly, In Australia, why are hospitalizations declining in July, while increasing in so many other places? Find the answer at the end of this update.
As we all know, there is very little testing occurring so looking at cases is not representative of the true level of transmission or the impact that it may be having on people’s lives.
Looking at the number of hospitalizations, below, COVID is having a much harsher impact this July than in July of 2023.
New Zealand
KP.3 sub-variants are continuing to gain momentum and displace earlier variants.
The variant 'JN.1' includes all lineages with a JN.1 spike protein, except JN.1.16, KP.2, and KP.3 which are reported separately.
When school resumes in New Zealand, the prevalence will likely begin increasing within 4 to 8 weeks unless all of the children have built a strong enough immunity to the KP.3 sub-variants. Given that the KP.3 variants are still expanding, many more children will likely be susceptible to these variants and become silent spreaders into the community.
In Auckland, New Zealand, the school break for July 2024 is from Saturday 6 July to Sunday 21 July 2024.
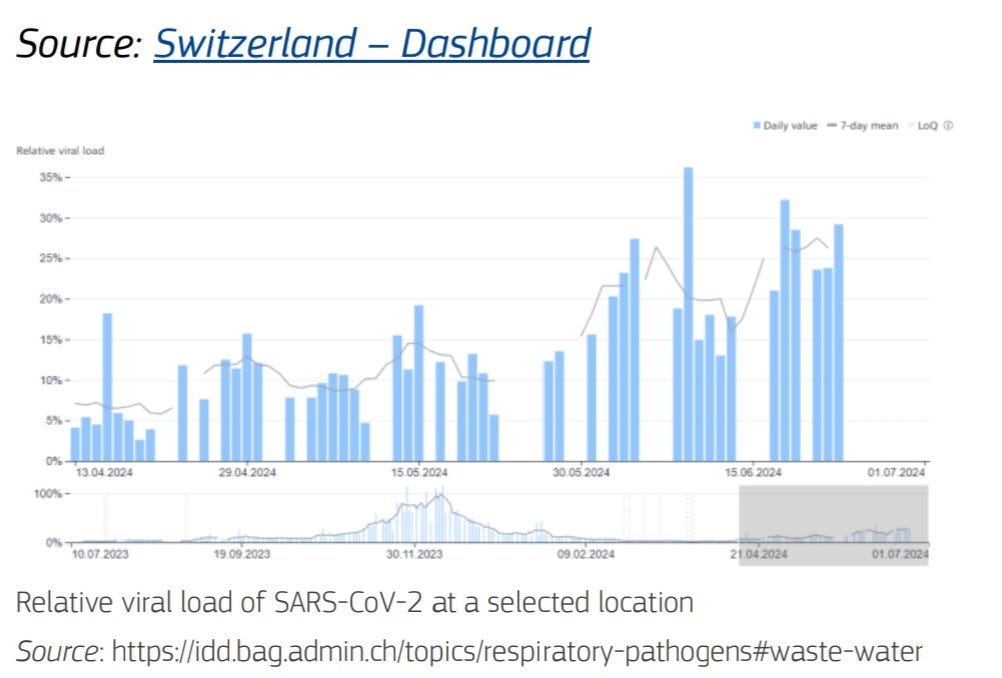
Switzerland Wastewater Prevalence
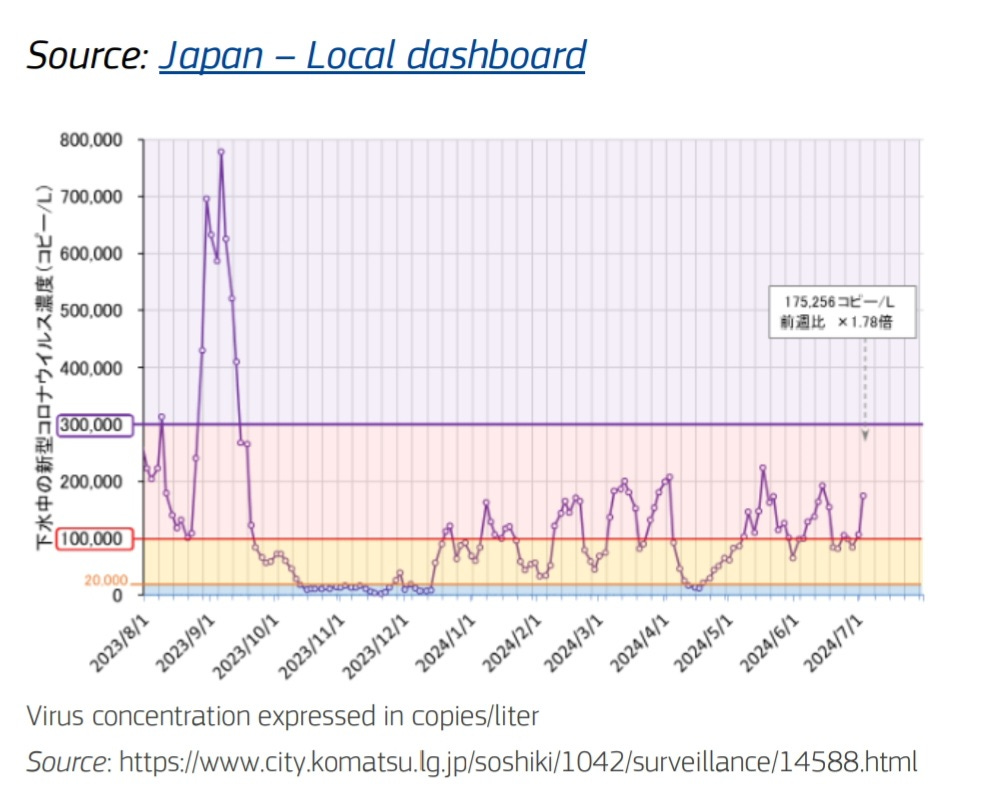
Japan Wastewater Prevalence
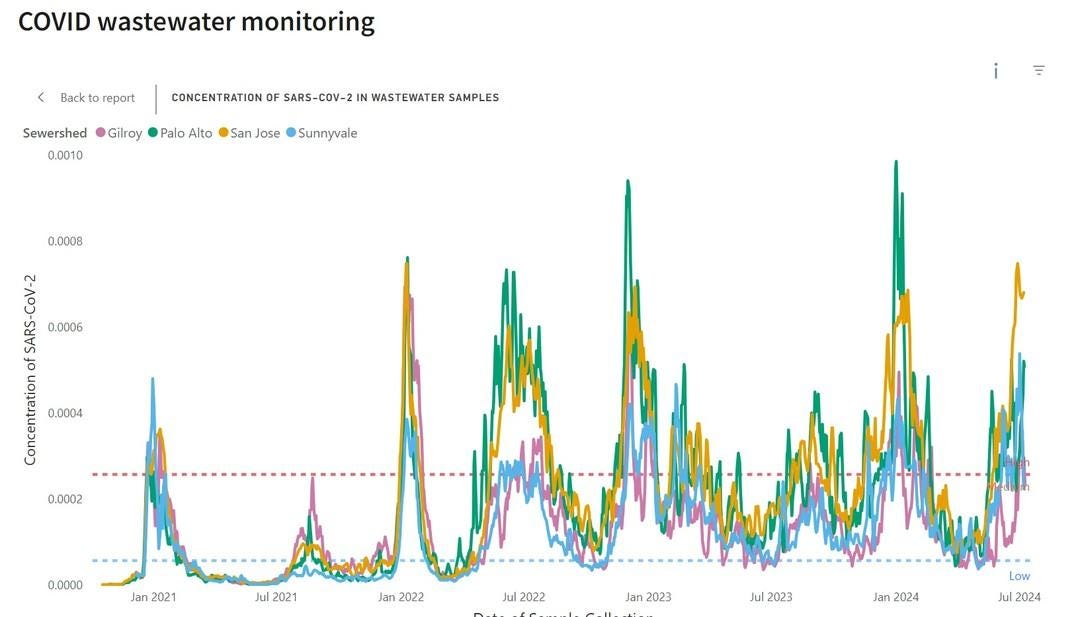
Gilroy, Palo Alto, San Jose, and Sunnyvale, California Wastewater Prevalence
Lastly, adding this for those in CA, U.S.
Understanding COVID-19 Peaks: A Comparison Between the U.K. and U.S.
You might wonder why the highest COVID-19 peak in the U.K. occurs in October, with a smaller surge in late December and early January, while the U.S. experiences a consistent surge from October through December, peaking in late December and early January. The answer to this question is provided at the end of this update.
The difference in the timing of these peaks can be attributed to the school break schedules in the U.K. In October, the U.K. has a two-week school break that varies by country. Here are the general dates for 2023:
England: October 23rd to 27th
Wales: October 30th to November 3rd
Scotland: October 6th to 17th
During this two-week break, children are away from school, which allows them to clear the virus, halting its exponential growth and leading to a decline in cases. Once schools reopen, the exponential growth resumes. It takes about 4 to 8 weeks for the virus to spread between schools and homes, surpassing the community rate and causing an overall increase in prevalence by late November or early December. This pattern continues until the next two-week break at the end of December, which again stops the exponential growth and leads to a decline in cases into March.
In contrast, the U.S. does not have a similar mid-term break in October, leading to a consistent rise in cases throughout the fall and into the winter months. This consistent exposure without a significant interruption contributes to a steady increase in cases, peaking in late December and early January. Implementing a 2-week school break in late October would prevent millions of infections in children, teachers, and the rest of society. A 4 term calendar, similar to Australia and New Zealand, with 4 separate 2-week breaks would decrease the surges in the U.S. considerably.
This isn’t going to prevent transmission as anyone paying attention in Australia or New Zealand can attest to but it would stunt the exponential growth. The transmission between groups of children and their siblings at home drives COVID surges. This happens during the school year and also during the summer through summer school, camps, daycares, and other group activities. Clean air for kids is an investment in children’s future and all of society’s health.
Speaking of Australia, The last two-week school break in Australia varied depending on the state or territory. In Victoria, 29 June to 14 July 2024. New South Wales: 8 July to 19 July 2024. Western Australia: 29 June to 14 July 2024. Northern Territory: 22 June to 14 July 2024. South Australia and Tasmania: 6 July to 21 July 2024.
This would explain why there has been a decline in hospitalizations since July 2nd and a decline in outbreaks at care homes. This also means the exponential growth of the new variants has likely already resumed and that the decline we see will reverse within the next 4 to 8 weeks. In reality, the transmission is already growing, and with the KP.3.1.1 variant and others, it will spread quickly. Remain vigilant and stay safe.
Support TACT: Together Against COVID Transmission
TACT is dedicated to providing the latest data, science, and insights to find a sustainable path forward that leaves no one behind. Our mission is to ensure that everyone, regardless of where they live, has access to accurate and up-to-date information about COVID-19.
Now, more than ever, it's crucial to keep this valuable source of information accessible to everyone globally. TACT is read in 48 U.S. states and 54 countries, reflecting our commitment to a worldwide audience, however, we need to reach even further.
Creating this essential content takes time, and time is money. Currently, TACT's Substack does not generate enough income to support the necessary time investment. To continue this work, and hopefully expand it, help is needed.
You can help by:
Becoming a paid subscriber: Your subscription directly funds the research and writing that goes into every post.
Referring a friend: Spread the word about TACT and help this reach more people.
Gifting a subscription: Share the gift of knowledge with someone else.
Donating to TACT’s fundraising campaign: You can contribute through PayPal to support TACT’s mission. Click the link here: TACT’s Fundraising Campaign
Together, we can continue to fight COVID-19 and keep everyone informed. Thank you for your support!
Please share any insights, questions, or stories in the comments.








Hi TACT...Don't know if you'll see this comment, but here goes...
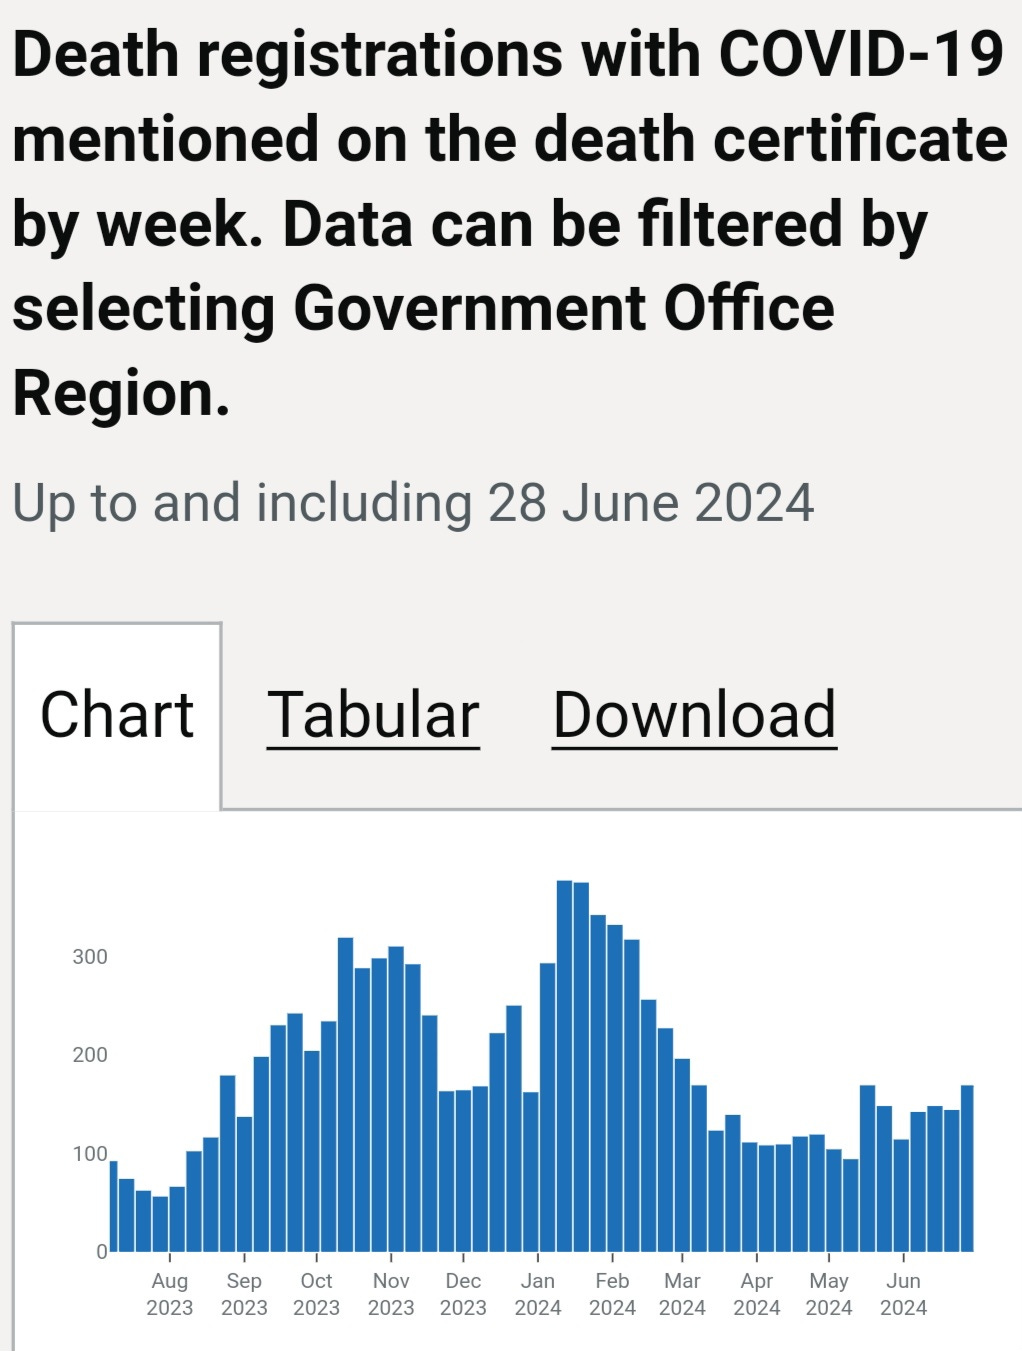
I was just looking again at the graph of confirmed UK Covid hospitalizations.
Note that there is a peak in early May followed by a trough in early June before hospitalizations start rising again. 30 days peak to valley. THAT is pretty ominous. Perhaps this is relentless immune evasion or shattered immunity generally, but it's not good.
Thought I would pass this along, if interested...
https://x.com/CovidSafetyEd/status/1815196831963660656