Exploring the Next Wave of COVID: Variant Updates and Future Projections
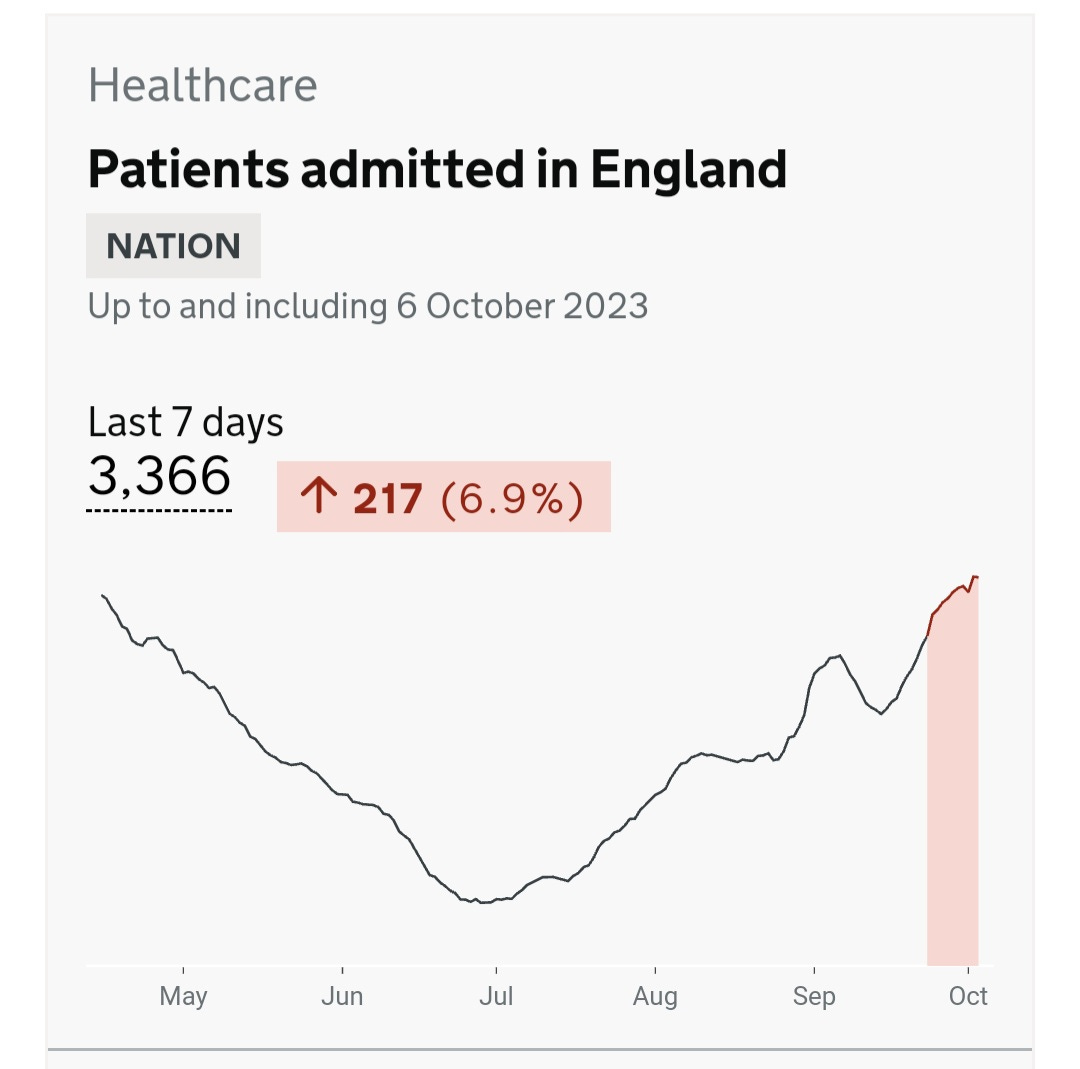
Hospitalizations Increasing in England to the New England States, Holding Hospitals Accountable for Patient Safety
From England to the New England states, hospitalizations are increasing. We are seeing this in places that have dramatically decreased testing of patients and decreased reporting, even when they are testing, so there is a good chance the actual numbers are significantly higher. Hospital-acquired COVID infections will often go unreported because it isn't in a hospital's interest to have a record showing they were responsible for making a patient worse. COVID infections are preventable, and by refusing to implement proper infection control, hospitals could be held responsible for the potentially devastating consequences. The only way they will change is if people hold them accountable. Make sure anyone you know that is hospitalized for any reason gets tested for COVID if they have symptoms or even if they don't but suddenly stop improving and begin deteriorating further. Keep the records of these tests.
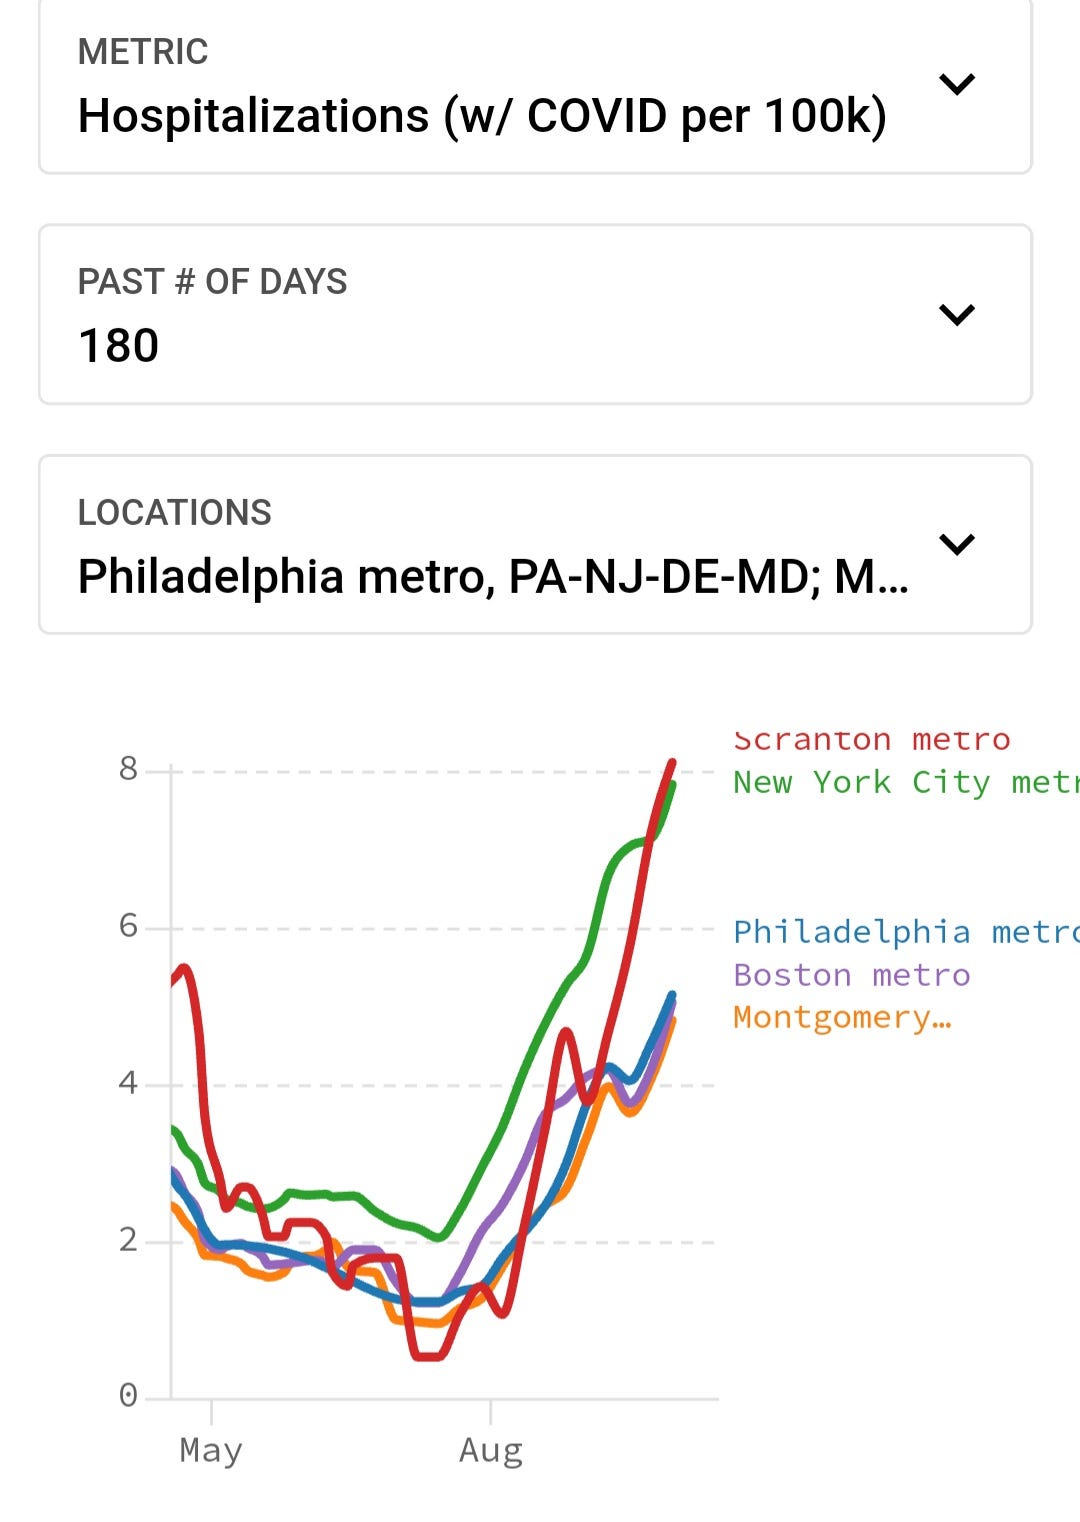
Hospitalizations continue to increase across the NE U.S.
Wastewater Prevalence
When we look at the regional wastewater data we see that the NE U.S. continues to increase, while the other regions have stopped decreasing and are leveling off. They will very likely start increasing going into mid-November. We will dig into why that occurs below.
If we look at the year-over-year trend of COVID prevalence on the national level, we can observe that this year closely mirrors the situation in 2021. We are facing a similar scenario as we enter November and December this year. New variants have emerged, showing significant mutations compared to the currently circulating ones. These variants are the most immune-evading and suppressive ones discovered to date, posing a high likelihood of escaping the immune response triggered by the existing variants. This implies that a majority of people, even those recently vaccinated with the XBB.1.5-targeted vaccines, will remain susceptible to infection and long-term persistence throughout the body, potentially even in the brain. The potential for a massive surge in infections, hospitalizations, and long-term persistence, leading to a range of long-term symptoms, is undeniably present. Long COVID could impact millions more people and worsen the condition of those already suffering from Long COVID symptoms.
As we progress in our analysis, we are going to go over the reasons for the expected surge in greater detail. We’ll unveil a hypothesis that can be used to predict when surges end and we'll review the intricate dynamics of these variants, discussing not only their current prevalence but also their potential implications for the coming months.
Don't miss out on valuable insights! Join our community of informed readers for free today. You will get an email when the paywall comes down, granting you access to the full article.
The research requires extensive time and effort to uncover crucial insights. By becoming a paid subscriber, you're not only gaining access to exclusive content but also actively supporting the future of this important work. Contribute to our mission by becoming a valued paid subscriber today.
Analyzing the Synchronized Surge in COVID Hospitalizations Across Continents: Unveiling the Common Source
We can look at the COVID hospitalization in the U.S., U.K., Canada and Australia in November 2021 through January 2022, we see a huge surge in hospitalizations. How could all these countries be so synced in the surge when they are on different continents and in the case of Australia, even different hemispheres, thus have different seasons? The answer is simple. There must be one common source of transmission driving the surge. A source that changes the behavior of a huge group of people long enough to cut off the exponential growth at the same time in each of the countries.
The Break that Resets: Exploring the School Holiday Hypothesis for COVID Exponential Decay
Each of these countries take an extended break from schools for the new year and the religious holidays. The extended break acts like a firewall stopping and resetting the exponential growth between classrooms and homes, from students to siblings to new classrooms.
Hypothesis:
Pathogenic Exponential Decay occurs when schools close for a duration sufficient for students and staff to clear a pathogen with an Ro greater than 1. During this period, the exponential growth of the pathogen is halted. When schools reopen, the exponential curve resets to the community rate or even lower, effectively facilitating exponential decay across all age groups. This phenomenon arises as the exponential curve in the principal source of transmission is reset, mitigating the spread of the pathogen.
This applies to all pathogens with an Ro > 1. Examples: Influenza, RSV, & SAR-CoV-2.
Ro represents the basic reproduction number of a pathogen, and it signifies the average number of secondary cases that a single infected individual is likely to generate in a completely susceptible population. For example, The Ro for the Delta variant was believed to be in the range of 5 to 8, while the original strain of the virus had an estimated Ro of around 2 to 3. The Ro for seasonal influenza strains and for RSV typically ranges from 1.2 to 2.0, which is why the exponential growth takes longer to be seen.
Why does the U.S. show a growth in transmission building from November, gaining more momentum, and infecting far more people than in Australia, Canada, and the U.K.?
Australia divides its school year into four terms. Term 3 ends in mid to late September, and term 4 begins in early to mid-October, concluding in mid-December. The first term doesn't start until late January. These term breaks act as firewalls, preventing the exponential growth seen in the U.S. starting in November, thereby protecting millions from infections.
In Canada, many schools take a 10-day break in October. For instance, Toronto is observing an October Holiday from October 6, 2023, to October 17, 2023. In the U.K., there is a 10-day break in late October. Children are off from school in England and Wales from October 21, 2023 through October 30th. Since people are most contagious for 8 to 10 days, the vast majority of infectious students have time to clear the virus and return without being contagious. Unfortunately, for the U.K. and Canada, children infected just before the break may still be contagious, setting off exponential growth slightly earlier than in Australia and resulting in more infections and hospitalizations.
A two-week school break in late October, into early November could significantly reduce the exponential growth observed from November into mid-January.
If the U.K. and Canada were to extend their breaks by a few more days, they could delay the exponential growth, preventing a considerable number of infections, hospitalizations, cases of Long COVID, and deaths. If the U.S. were to learn from this lesson, adding a break in late October into early November could be the most advantageous time to incorporate a two-week school break into the calendar.
Ventilation to Reduce Transmission
A much more effective long term solution is to upgrade or install new HVAC systems that filter virus laden aerosolized droplets out of the air and increase ventilation to maintain CO2 levels at 600ppm.
Why do we need to maintain CO2 levels around 600 ppm?
Reducing CO2 levels in the air decreases the time airborne SARS-CoV-2 can remain infectious. This study, published in June 2023 says, “The role of pH sensitivity as a primary driver of the loss of viral infectivity in the aerosol phase is demonstrated through comparison of the bulk and aerosol survival of SARS-CoV-2 variants of concern (VOCs).” In other words, they say that ventilation doesn't only clear viral particles but also shortens the time any remaining particles remain infectious.
This study adds more support to the above study. They looked at “SARS-CoV-2 airborne infection probability estimated by using indoor carbon dioxide” They showed that the "indoor CO2 concentration at which R0 does not exceed 1 is below 620 ppm with no mask, 1000 ppm - surgical mask & 16000 ppm -N95 mask.” They also show that using N-95 masks are highly effective at limiting transmission and significantly reducing exposure.
The cumulative data shows that by reducing CO2 levels, transmission decreases. When CO2 increases, as we would expect based on the studies above, so does transmission risk. This was shown here in April 2021, “CU Boulder duo confirms value of measuring carbon dioxide to estimate infection risk.” They showed that "an influx of people makes CO2 jump from 800 to 1,600 (400 to 1,200 above background), COVID transmission risk triples."
We know much more than we did in 2021 and there is no excuse for hospitals or schools to dismiss the science. We obviously can’t rely on the corporate controlled CDC to provide guidance that prevents transmission. We must follow the cumulative science and data. We know what has to be done. It is up to everyone else to take the actions necessary to make it happen.
COVID Variant Update and Forecast through February
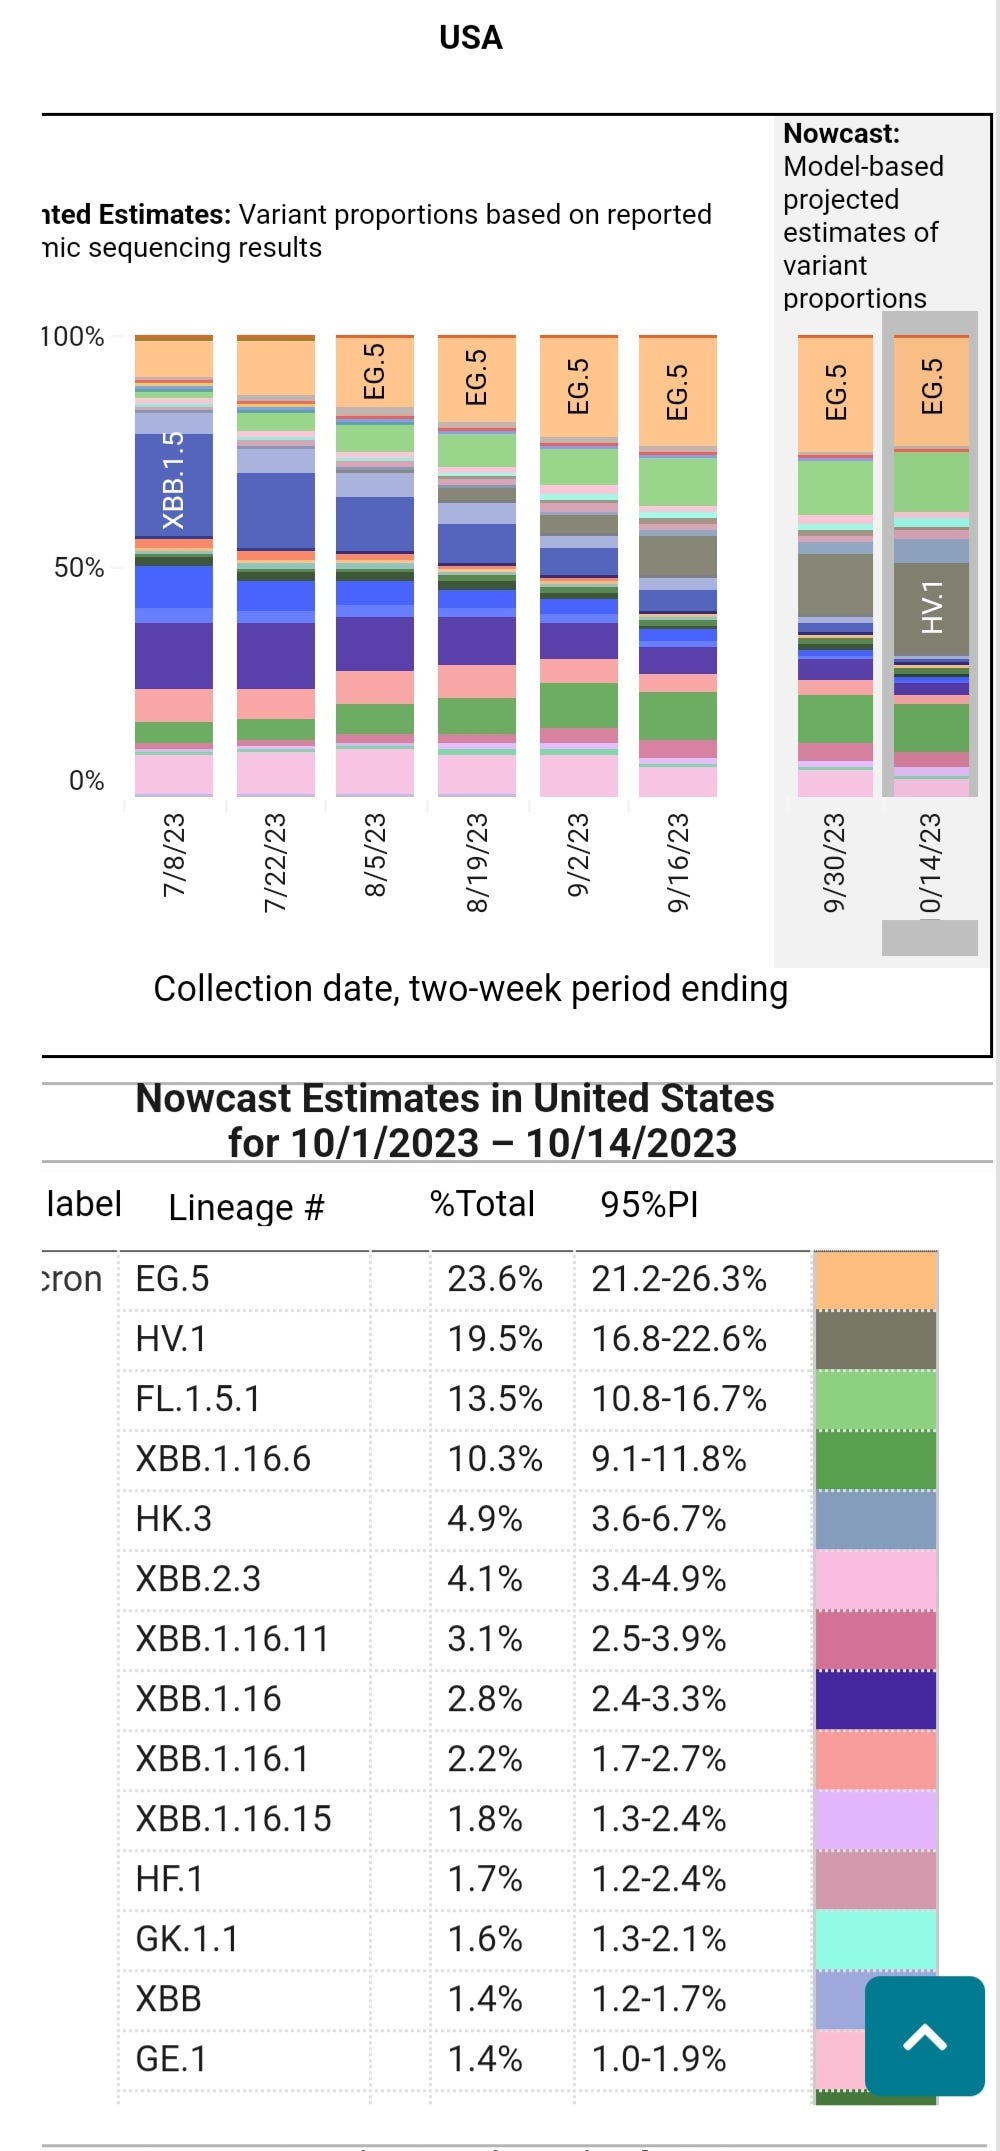
HV.1 continues to expand in prevalence, and HK.3 is a newer variant gaining ground rapidly. These variants continue to accumulate more immune-evading/suppressive mutations, increasing their likelihood of persisting throughout the body in viral reservoirs.
In Region 3, which includes PA, VA, DE, and MD, HV.1 has become the dominant variant. In the U.S. as a whole, HV.1 is still on the rise, displacing EG.5. The newer variant on the scene, HK.3, is outcompeting other variants and becoming increasingly prevalent. However, as we will see below, there are more significant concerns on the horizon.
COVID Evolution
The following image depicts that HV.1 continues to accumulate new mutations. One noteworthy mutation, S:S172Y in Wisconsin, lacks supporting studies, but it has appeared at various points in the evolution of SARS-CoV-2. Time will tell if this mutation confers any additional advantage.
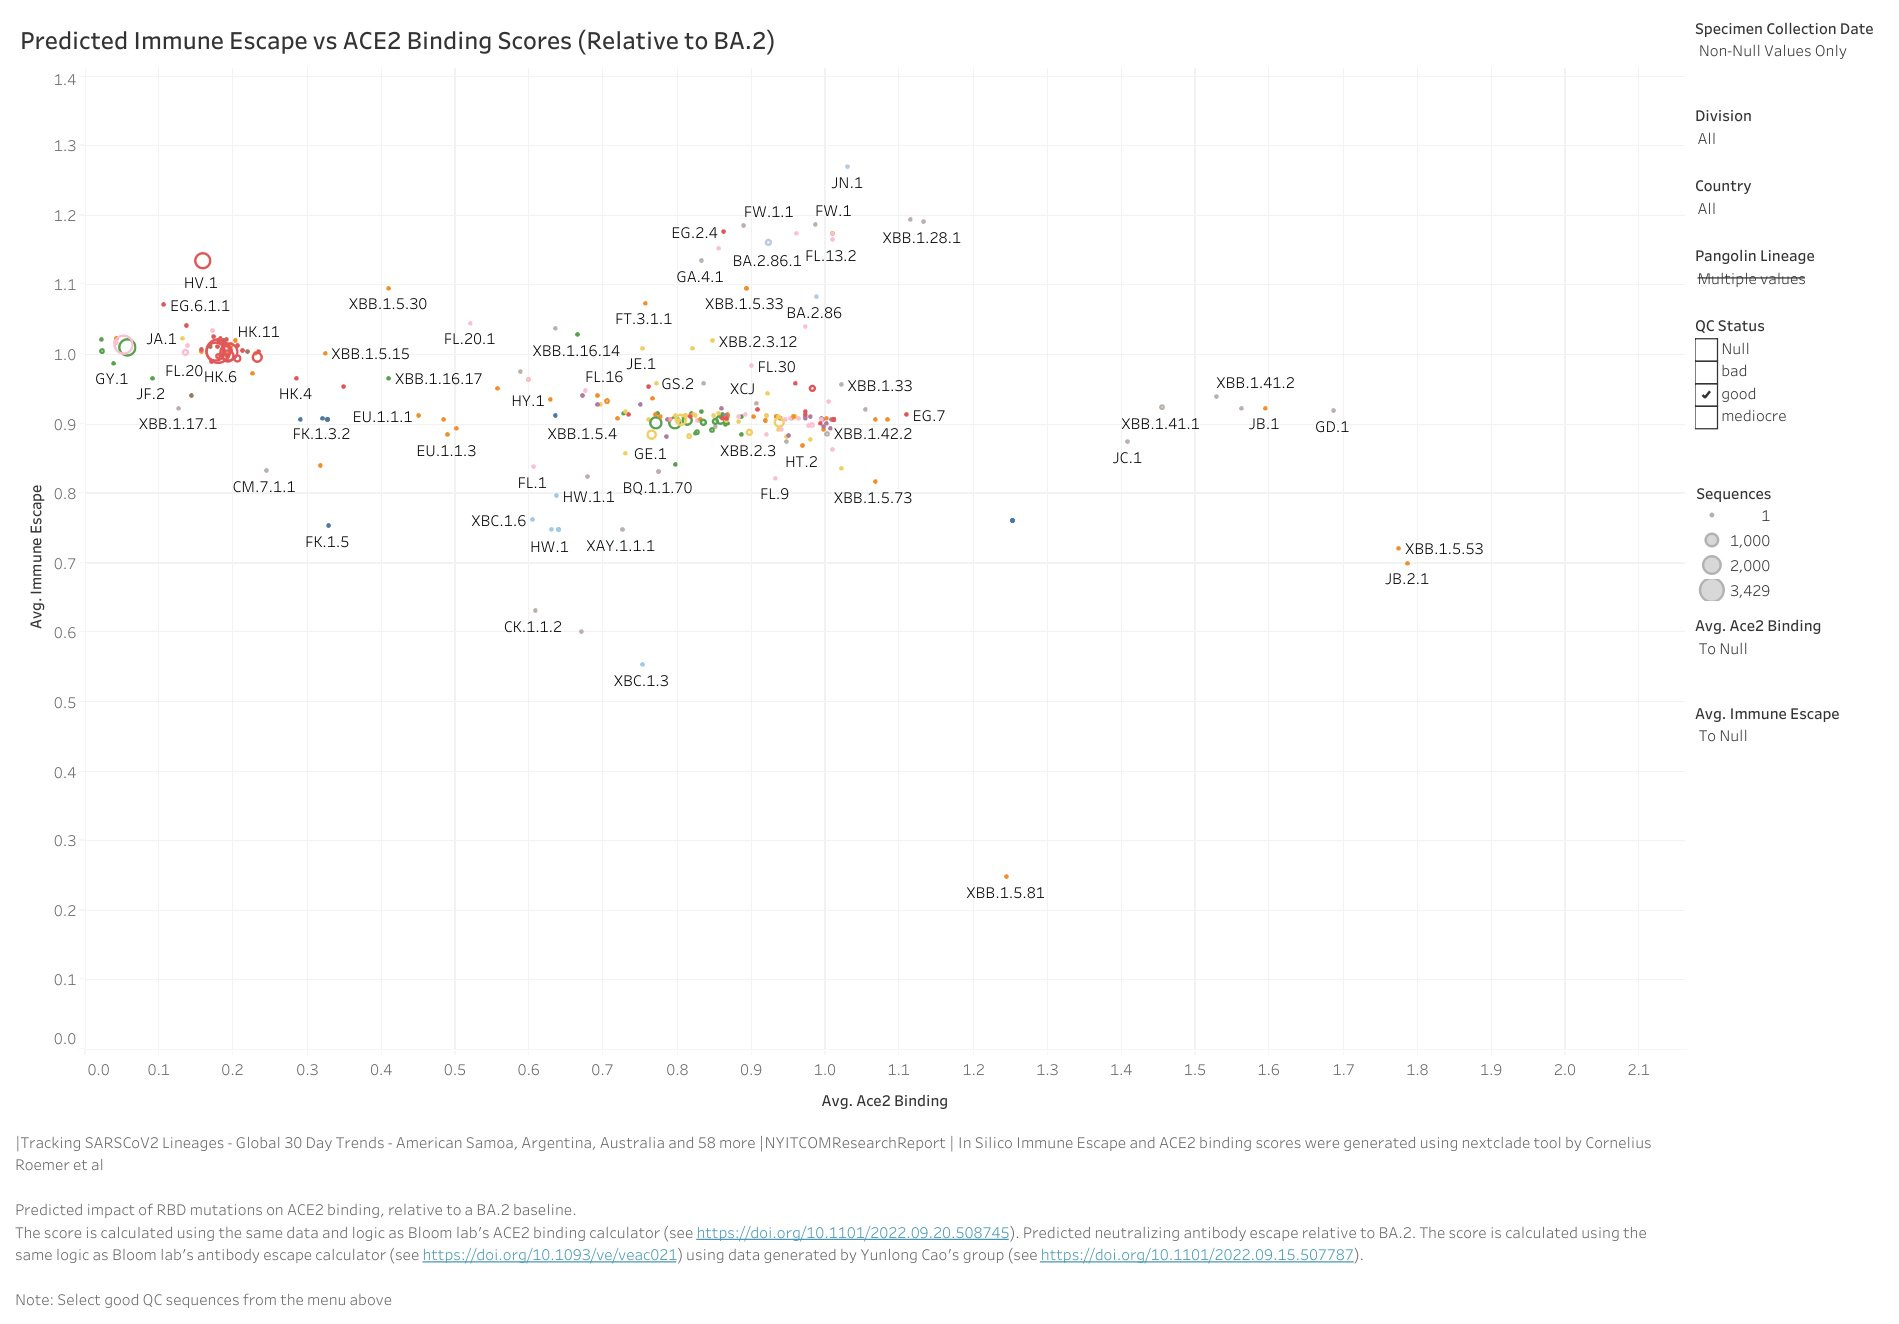
If we closely examine the chart below, we can see that HV.1 exhibits a very high immune escape level compared to earlier variants. However, it has low ACE-2 binding, which may limit its ability to attach to cells in the body. This could be positive news if accurate. Referring back to the chart at the beginning, which showed the year-over-year comparison in wastewater prevalence, one reason for a potential significant surge this year is that HV.1 is a descendant of the XBB variants, and BA.2.86 (Pirola) and its subvariants have demonstrated to be antigenically distinct from the XBB variants.
Furthermore, considering that BA.2.86 subvariants are evolving to be much more immune-evasive than anything observed so far, along with an increased ability to bind to ACE-2 receptors compared to HV.1, we are confronted with a new family of variants with a high likelihood of rapidly surging between classrooms, homes, and communities during this process. Notably, on the graph above, JN.1, a BA.2.86 subvariant, stands out as the most immune-evasive and further from HV.1 in terms of binding to cells. If HV.1 can dominate in an environment with a high number of XBB descendant infections, we can only imagine what an antigenically distinct variant with significantly greater immune evasion and ACE-2 binding will achieve. It's worth noting that since this graph was created, the Pirola family of variants has continued to grow.
BA.2.86.1(ORF1a:K1973R)
JN.1BA.2.86.1.1 (S:L455S, ORF1a:R3821K, ORF7b:F19L)
JN.2BA.2.86.1.2 (ORF1a:Y621C)
JN.3BA.2.86.1.3 (ORF1a:T2087I)
BA.2.86.2(ORF7a:E22D)
BA.2.86.3(C222T, C1960T, T12775C)
JQ.1BA.2.86.3.1 (S:T95I)
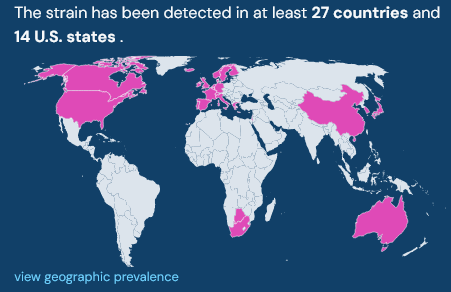
Observing the expansion of BA.2.86, BA.2.86.1, and JN.1, excluding recent additions, reveals their presence in at least 27 countries and 14 U.S. states. It's essential to note that many parts of the world conduct limited genomic sequencing, so it may take time for them to identify these variants.
TACT Forecast for November through February
Based on the available data, a potentially dangerous situation is emerging. We must consider the combination of factors presented by the BA.2.86 subvariants, also known as the Pirola family of variants. These factors include the highest level of immune escape to date and greater cellular binding than the currently surging HV.1 variant. When combined with millions of people with weakened immune systems from recent infections and no mitigation measures in schools, hospitals, or elsewhere, there is a high likelihood of a significant increase in transmission, Long COVID, hospitalizations, and deaths over the next four months. We should prepare for a surge similar to the 2021/2022 Omicron surge that could extend into the first or second week of January. The most likely scenario is that the Pirola family surge will be milder than 2021/2022 but substantially higher than the 2022/2023 surge. Starting in mid-January, we should see exponential decay continuing into February.
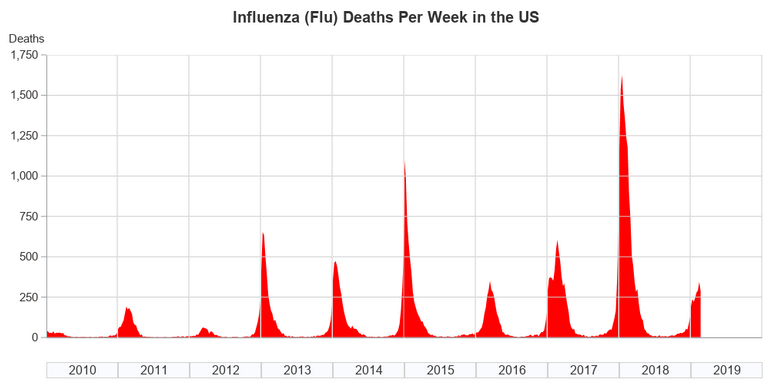
It's almost certain that without changes in mitigation within schools, millions of children will fall ill and risk long-term damage. Millions of parents will miss work and face an increased risk of Long COVID for months or years, and many more children will lose their grandparents. Coinfections have been shown to be more severe. As shown above, the flu will be spreading widely. RSV and other respiratory viruses will circulate, increasing the risk of severe symptoms and long-term complications. Considering that we have very limited data on how the emerging variants will impact Long COVID or symptoms in the acute phase, we should take every available precaution to mitigate transmission.
Every time someone interrupts chain of transmission, lives are protected, preventing Long-COVID, hospitalizations, and deaths. If everyone, especially countries with daily international travel, takes steps to mitigate the influx of new variants, it could make a significant difference. Implementing measures to prevent transmission in hospitals and, importantly, schools can substantially reduce the number of people affected by the upcoming surge.
Strategies to Avoid Infection
Prevention is the Best Medicine
COVID Causes Vascular Dysfunction
“SARS-CoV-2 infects coronary vessels, inducing plaque inflammation that could trigger acute cardiovascular complications and increase the long-term cardiovascular risk."
"SARS-CoV-2 infection triggers pro-atherogenic inflammatory responses in human coronary vessels" (Sept 28, 2023)
Ignoring airborne transmission aids the speed of evolution and creates more opportunities for large jumps like we recently saw with BA.2.86 (Pirola). We are helping this virus every day by ignoring airborne transmission.
We can protect the health, quality of life and the longevity of people while bringing down expenditures on healthcare. That money can be invested in schools and towards the betterment of individuals lives. Billions of people could have a better quality of life if we simply understood that providing Clean Air for Kids is absolutely essential. We must work Together Against COVID Transmission.





Hi TACT...
Just a head's up in case you hadn't heard...Biobot lost the contract with CDC for wastewater surveillance. It went to a company called Verily or something like that. So, be aware of this as you try to model this virus.
Please provide the journal reference for articles you quote. Do you have the reference for this quote - , “The role of pH sensitivity as a primary driver of the loss of viral infectivity in the aerosol phase is demonstrated through comparison of the bulk and aerosol survival of SARS-CoV-2 variants of concern (VOCs).”
Thanks